Working with shapes from databases
Icon Map Pro provides the ability to display shapes that are stored, or referenced via the Power BI semantic model. These shapes are stored either as WKT (Well-known Text) or GeoJSON features. Many popular databases provide the ability to store shapes using the native 'Geography' or 'Geometry' data types, which are then surfaced in Power BI as WKT or geoJSON. Examples of databases providing this capability include, SQL Server, Azure SQL, Fabric SQL, Fabric Warehouse (stored in text fields), Oracle, KustoDB / Eventhouse (stored in text fields), PostgreSQL, Snowflake etc.
Benefits of using shapes from data
There are a number of reasons why you might want to source your shapes from data:
Single source of the truth
Your organization may provide a single repository for geospatial boundaries, such as assets, sales areas etc. Using this single source then ensures that all geospatial visualizations are using the same set of shapes.
Performance
When using shapes from sources such as uploaded files, it's necessary to relate the shapes in the file to the Power BI data using the Feature Reference field. This process has a performance overhead. When using shapes provided as part of the Power BI dataset, this mapping process isn't required, as the shapes are included in the dataset itself.
Changes over time
Some assets are not static. Their shape, position or composition may change over time. By loading the shapes from source data, the Power BI report will always show the latest version of these shapes, as the Power BI dataset is refreshed, or in near-realtime when using a direct query connection.
Challenges using shapes from data
Power BI truncates data to 32766 characters
As some shapes may be large and complex containing many points, this can result in WKT or GeoJSON text that has a large number of characters. Power BI on the other hand can only store text in a single column up to 32766 characters. This can result in your shapes being truncated and no longer valid WKT or GeoJSON, resulting in them not displaying on the map. There are a number of approaches to tackling this that are described later in this page.
Nuances of different databases
Different databases may surface geospatial data in different ways. For example, when including a field of type geography in SQL Server, Power BI automatically represents this field as Well-Known Text, whilst when using PostgreSQL, it is necessary to use the ST_AsText() function to manually convert the WKB data to WKT.
Approaches for exceeding Power BI's character limit
There are a few main approaches for dealing with the 32766 character limit, which can be used independently or together:
- Reduce the complexity of the shapes before loading them in Power BI
- Reduce the number of decimal places used to store coordinates
- Split the shapes into multiple rows and columns as they're being loaded into Power BI, then use DAX to join them back together
This section looks in detail at these different approaches.
Reduce the complexity of the shapes
If your loading in the shapes using Power Query from a static file, then you will need to use an external tool such as QGIS or mapshaper.org to simplify the shapes before selecting them as a source in Power BI. However if you're using a database as the source, you may be able to use the spatial functions provided by the database engine to simplify the shapes. This could be done as a query (SELECT statement), a view or a function that returns a table, depending on the type of system you're connecting to.
The commands and syntax for differs between providers.
- SQL Server / Azure SQL / Fabric SQL
- PostgreSQL
- Oracle
SQL Server provides the Reduce function to simplify shapes. Eg:
SELECT shape_name, wkb_geometry.MakeValid().Reduce(100) AS geom
A recursive query can be created that will iteratively reduce the complexity of shapes until they are under Power BI's limit. The following example assumes three fields:
shape_code (a reference for the shape), shape_name (name of the shape), wkb_geometry (the shape as a geography data type)
WITH GeometryReduction AS (
 -- Anchor member
 SELECT
     shape_name,
     shape_code,
     wkb_geometry.MakeValid() AS geom,
     CAST(0.0 AS FLOAT) AS tolerance,
     LEN(wkb_geometry.MakeValid().STAsText()) AS length
 FROM shapes

 UNION ALL

 -- Recursive member
 SELECT
     shape_name,
     shape_code,
     geom.Reduce(CAST(tolerance + 100.0 AS FLOAT)) AS geom,
     CAST(tolerance + 100.0 AS FLOAT) AS tolerance,
     LEN(geom.Reduce(CAST(tolerance + 100.0 AS FLOAT)).STAsText()) AS length
 FROM GeometryReduction
 WHERE length > 32766 AND tolerance < 10000 -- safeguard
)

SELECT
 shape_name,
 shape_code,
 geom.STAsText() AS reduced_text
FROM (
 SELECT
     shape_name,
     shape_code,
     geom,
     ROW_NUMBER() OVER (PARTITION BY shape_code ORDER BY tolerance ASC) AS rn
 FROM GeometryReduction
 WHERE length <= 32766
) AS FinalReduced
WHERE rn = 1;
The result of running this query will be the shape_name, shape_code and reduced_text (the shape in WKT format simplified to under 32766 characters)
PostgreSQL provides the ST_SimplifyPreserveTopology function that we can use to simplify shapes
SELECT shape_name, ST_SimplifyPreserveTopology(geom, 100) AS geom FROM Shapes
A recursive query can be created that will iteratively reduce the complexity of shapes until they are under Power BI's limit. The following example assumes three fields:
shape_code (a reference for the shape), shape_name (name of the shape), wkb_geometry (the shape as a geography data type)
WITH RECURSIVE geometry_reduction AS (
  -- Anchor member: start with MakeValid() and no simplification
  SELECT
    shape_name,
    shape_code,
    ST_MakeValid(wkb_geometry) AS geom,
    0.0::double precision AS tolerance,
    LENGTH(ST_AsText(ST_MakeValid(wkb_geometry))) AS length
  FROM shapes

  UNION ALL

  -- Recursive member: incrementally simplify using ST_SimplifyPreserveTopology
  SELECT
    shape_name,
    shape_code,
    ST_SimplifyPreserveTopology(geom, tolerance + 100.0) AS geom,
    tolerance + 100.0,
    LENGTH(ST_AsText(ST_SimplifyPreserveTopology(geom, tolerance + 100.0))) AS length
  FROM geometry_reduction
  WHERE length > 32766 AND tolerance < 10000
)

-- Get the least simplified version that satisfies the condition
SELECT
  shape_name,
  shape_code,
  ST_AsText(geom) AS reduced_text
FROM (
  SELECT
    shape_name,
    shape_code,
    geom,
    ROW_NUMBER() OVER (PARTITION BY shape_code ORDER BY tolerance ASC) AS rn
  FROM geometry_reduction
  WHERE length <= 32766
) AS final_reduced
WHERE rn = 1;
The result of running this query will be the shape_name, shape_code and reduced_text (the shape in WKT format simplified to under 32766 characters)
Oracle provides the SDO_UTIL.SIMPLIFY function that we can use to simplify shapes
SELECT shape_name, SDO_UTIL.SIMPLIFY(geom, 100) FROM shapes
A recursive query can be created that will iteratively reduce the complexity of shapes until they are under Power BI's limit. The following example assumes three fields:
shape_code (a reference for the shape), shape_name (name of the shape), wkb_geometry (the shape as a geography data type)
WITH geometry_base AS (
  SELECT
    shape_name,
    shape_code,
    wkb_geometry AS geom,
    0 AS tolerance,
    LENGTH(SDO_UTIL.TO_WKTGEOMETRY(wkb_geometry)) AS len
  FROM shapes
),
geometry_recursive (
  shape_name,
  shape_code,
  geom,
  tolerance,
  len,
  lvl
) AS (
  SELECT
    shape_name,
    shape_code,
    geom,
    0 AS tolerance,
    len,
    0 AS lvl
  FROM geometry_base

  UNION ALL

  SELECT
    gr.shape_name,
    gr.shape_code,
    SDO_UTIL.SIMPLIFY(gr.geom, gr.tolerance + 100) AS geom,
    gr.tolerance + 100,
    LENGTH(SDO_UTIL.TO_WKTGEOMETRY(SDO_UTIL.SIMPLIFY(gr.geom, gr.tolerance + 100))) AS len,
    lvl + 1
  FROM geometry_recursive gr
  WHERE gr.len > 32766 AND gr.tolerance < 10000
)

SELECT shape_name, shape_code, SDO_UTIL.TO_WKTGEOMETRY(geom) AS reduced_text
FROM (
  SELECT shape_name, shape_code, geom, len,
         ROW_NUMBER() OVER (PARTITION BY shape_code ORDER BY tolerance ASC) AS rn
  FROM geometry_recursive
  WHERE len <= 32766
)
WHERE rn = 1;
The result of running this query will be the shape_name, shape_code and reduced_text (the shape in WKT format simplified to under 32766 characters)
Reduce the number of decimal places
Many geospatial servers store coordinates with a large number of decimal places. Whilst this results in highly accurate coordinates, it can also result in a coordinates taking up much more space than necessary for most Power BI maps.
Unfortunately SQL Server / Azure SQL / Fabric SQL and Oracle don't provide a built-in spatial function for achieving this.
However in PostgreSQL, the ST_SnapToGrid function can be used:
SELECT
  shape_name,
  ST_AsText(ST_SnapToGrid(geom, 0.001)) as geom
FROM shapes;
Split the shapes into multiple columns / rows
Whilst Power BI can only store text up to 32766 characters, in DAX it is possible represent up to around 2 million characters in a measure. Therefore, it is possible to split the shape upon loading it into Power BI, then use DAX to join the shape back together again, before being passed into Icon Map Pro.
The following approaches split the shapes into multiple rows, then use the CONCATENATEX DAX function in a measure. The rows can be split using PowerQuery during the import, or beforehand in the originating database. It's recommended that this is used in conjunction with the other approaches to reduce the complexity of the shapes as too many large shapes may exceed memory or resource limits within Power BI.
- PowerQuery
- SQL Server / Azure SQL / Fabric SQL
- PostgreSQL
- Oracle
Starting with the Shapes query:
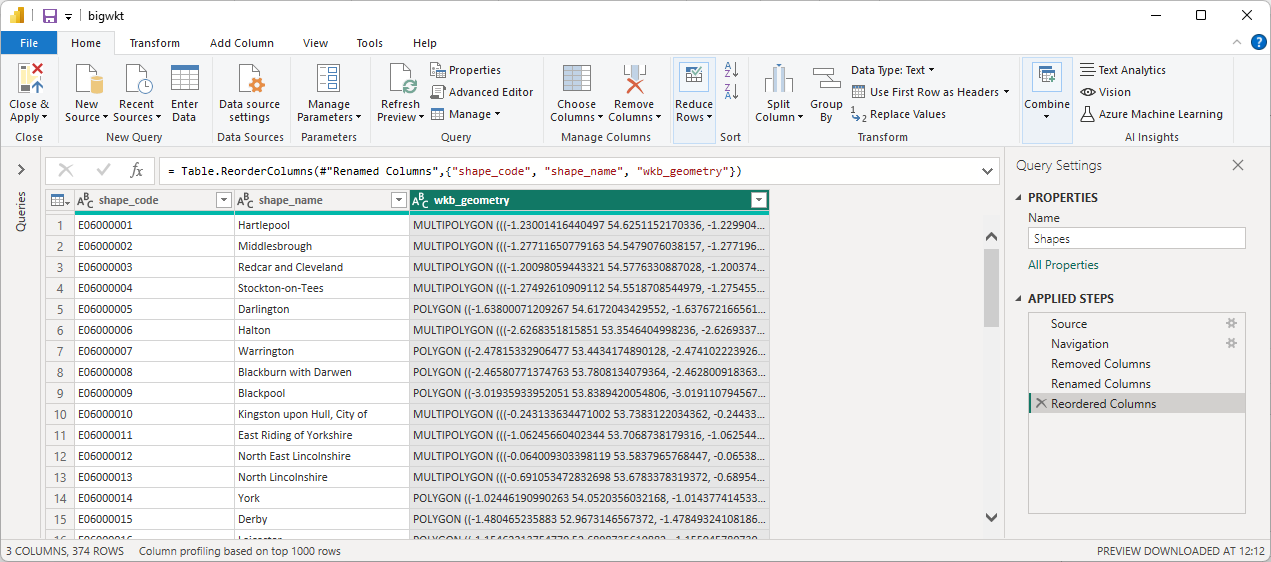
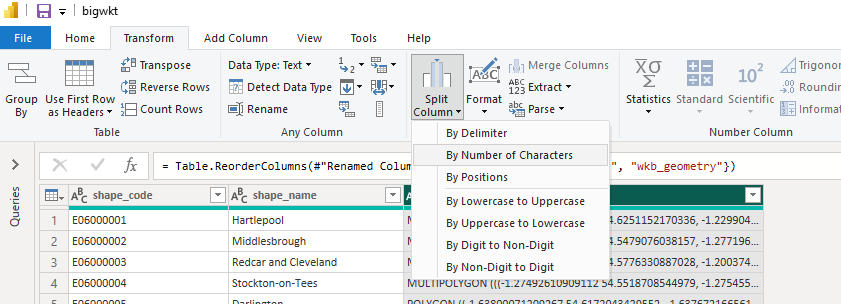
ensure the wkb_geometry column is highlighted, then select "Split Column" then "By Number of Characters" from the "Transform" menu:
Enter 32000 as the number of characters, and select "Rows" in the Advanced options section:
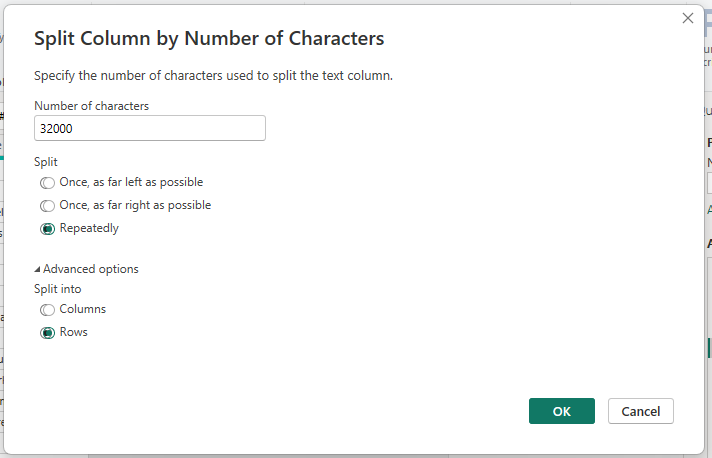
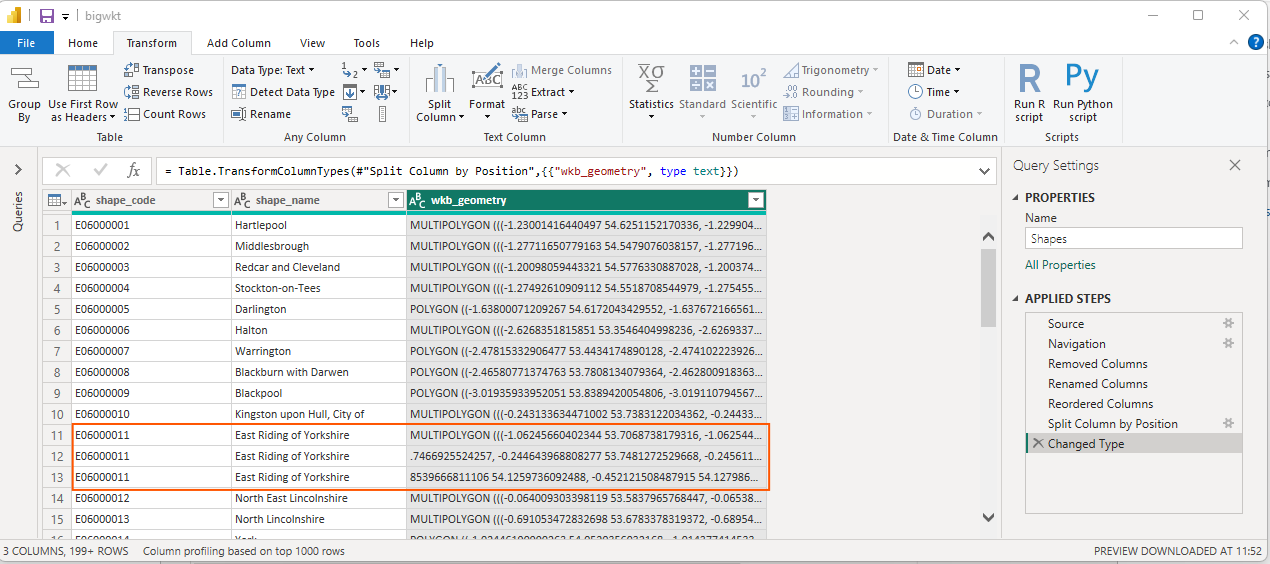
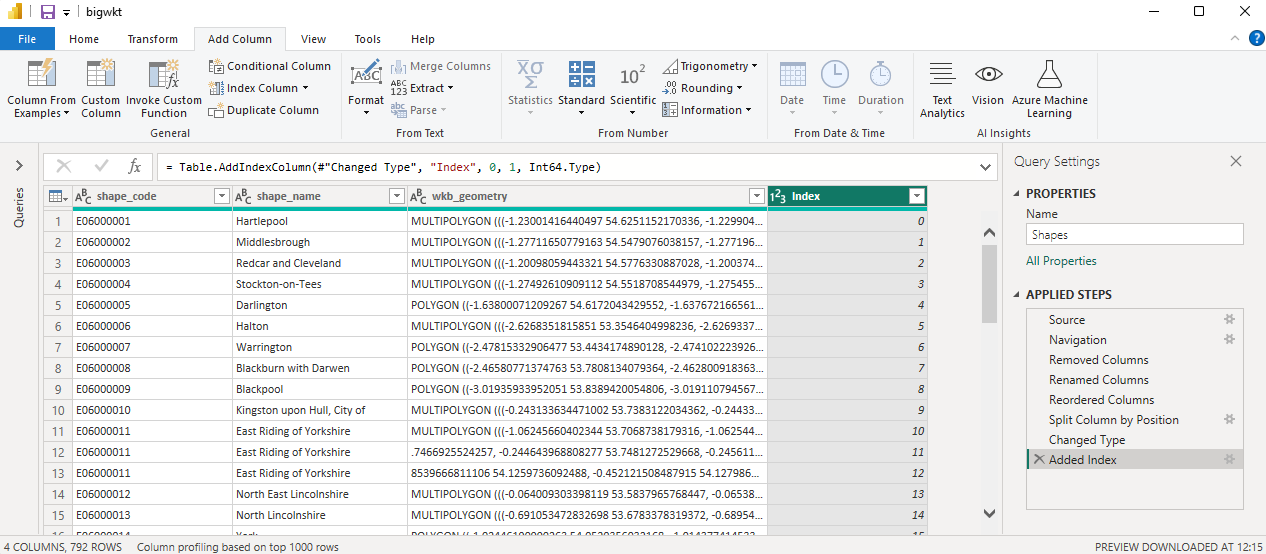
This will split the wkb_geometry column into multiple rows for those items where the length was over 32000.
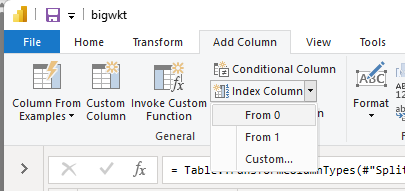
To ensure that the rows are combined in the correct order, we create an index column to use as the sort order later:
Then click the "Close and Apply" button to load the data.
Create the following measure:
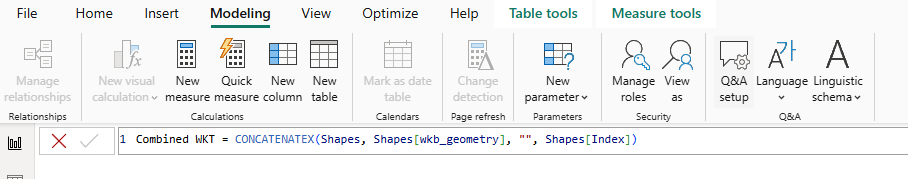
Combined WKT =
CONCATENATEX ( Shapes, Shapes[geom], "", Shapes[chunk_order] )
Then in Icon Map Pro, use the shape_code or shape_name field for 'ID' and the 'Combined WKT' field for 'Image / WKT / GeoJSON'
SQL Query:
WITH Numbers AS (
    SELECT TOP (1000)
        ROW_NUMBER() OVER (ORDER BY (SELECT NULL)) AS n
    FROM sys.all_objects
),
WKTChunks AS (
    SELECT
        shape_name,
        shape_code,
        n AS chunk_order,
        SUBSTRING(wkt, ((n - 1) * 32766) + 1, 32766) AS geom
    FROM (
        SELECT
            shape_name,
            shape_code,
            wkb_geometry.ToString() AS wkt,
            LEN(wkb_geometry.ToString()) AS wkt_len
        FROM shapes
    ) AS base
    JOIN Numbers ON ((n - 1) * 32766) < wkt_len
)
SELECT
    shape_name,
    shape_code,
    chunk_order,
    geom
FROM WKTChunks
ORDER BY shape_code, chunk_order;
DAX Measure:
Combined WKT =
CONCATENATEX ( Shapes, Shapes[geom], "", Shapes[chunk_order] )
Then in Icon Map Pro, use the shape_code or shape_name field for 'ID' and the 'Combined WKT' field for 'Image / WKT / GeoJSON'
SQL Query:
WITH wkt_base AS (
    SELECT
        shape_name,
        shape_code,
        ST_AsText(wkb_geometry) AS wkt,
        LENGTH(ST_AsText(wkb_geometry)) AS wkt_len
    FROM shapes
),
wkt_chunks AS (
    SELECT
        shape_name,
        shape_code,
        gs.n AS chunk_order,
        SUBSTRING(wkt FROM ((gs.n - 1) * 32766 + 1) FOR 32766) AS geom
    FROM wkt_base,
         generate_series(1, 1000) AS gs(n)
    WHERE ((gs.n - 1) * 32766) < wkt_len
)
SELECT
    shape_name,
    shape_code,
    chunk_order,
    geom
FROM wkt_chunks
ORDER BY shape_code, chunk_order;
DAX Measure:
Combined WKT =
CONCATENATEX ( Shapes, Shapes[geom], "", Shapes[chunk_order] )
Then in Icon Map Pro, use the shape_code or shape_name field for 'ID' and the 'Combined WKT' field for 'Image / WKT / GeoJSON'
SQL Query:
WITH wkt_base AS (
    SELECT
        shape_name,
        shape_code,
        SDO_UTIL.TO_WKTGEOMETRY(wkb_geometry) AS wkt,
        LENGTH(SDO_UTIL.TO_WKTGEOMETRY(wkb_geometry)) AS wkt_len
    FROM shapes
),
numbers AS (
    SELECT LEVEL AS n
    FROM DUAL
    CONNECT BY LEVEL <= 1000
),
wkt_chunks AS (
    SELECT
        wb.shape_name,
        wb.shape_code,
        n.n AS chunk_order,
        SUBSTR(wb.wkt, ((n.n - 1) * 32766) + 1, 32766) AS geom
    FROM wkt_base wb
    JOIN numbers n
      ON ((n.n - 1) * 32766) < wb.wkt_len
)
SELECT
    shape_name,
    shape_code,
    chunk_order,
    geom
FROM wkt_chunks
ORDER BY shape_code, chunk_order;
DAX Measure:
Combined WKT =
CONCATENATEX ( Shapes, Shapes[geom], "", Shapes[chunk_order] )
Then in Icon Map Pro, use the shape_code or shape_name field for 'ID' and the 'Combined WKT' field for 'Image / WKT / GeoJSON'