Combining multiple layer types on the same map
Configuring Icon Map for multiple layers
Icon Map Pro supports adding different types of data-bound items on the same map. This process is not trivial as Power BI does not provide a method for items from different tables in the Power BI semantic model to be added to the same visual, unless they are related in a way that allows them to be presented as a flat table.
For example, deprivation data displayed as a choropleth map in a GeoJSON layer, needs to be located in the same place as point data presented as circles.
The easiest way of achieving this is to have a single table containing all your data-bound map items. Each row represents an item to show on the map. Icon Map Pro determines which type of map layer that row represents based on which fields are populated.
For example to plot circles on the map the ID, Longitude and Latitude fields must be populated. All other fields must either not have fields assigned or contain null or BLANK() values.
| ID | Longitude | Latitude | Destination Longitude | Destination Latitude | Circle Size | H3 Weight | Image / WKT / GeoJSON | Feature Reference | Daylight Date & Time | Tooltips |
|---|---|---|---|---|---|---|---|---|---|---|
| Circle1 | -2.576 | 51.481 | null | null | 50 | null | null | null | (optional) | optional |
| Circle2 | -2.955 | 51.332 | null | null | 100 | null | null | null | (optional) | optional |
If destination longitude and latitudes were also provided on this row, then circles would not be displayed as the rows would then be configured for lines. Lines would only be displayed if the Lines toggle was also enabled in the Data Layers section of the Icon Map Pro formatting options, and the Circle Size data replaced with nulls.
When a data-bound layer type is enabled, each row in the dataset is evaluated to check if it has a configuration that matches that type of layer. It checks to make sure the appropriate fields have values (of the correct type), and that all other values are null, blank() or not configured. The following table shows how each type of layer requires its data to be presented:
| Layer Type | ID | Longitude | Latitude | Destination Longitude | Destination Latitude | Circle Size | Cluster Group | Heatmap Weight | H3 Weight | Image / WKT / GeoJSON | Feature Reference | Feature Weight |
|---|---|---|---|---|---|---|---|---|---|---|---|---|
| Circles | * | * | * | * | ||||||||
| Circles with Cluster Groups | * | * | * | * | ? | |||||||
| Heatmap | * | * | * | * | ||||||||
| H3 from coordinates | * | * | * | * | ||||||||
| H3 from cell indexes | * | * | ||||||||||
| Images | * | * | * | * | ||||||||
| Images with Cluster Groups | * | * | * | ? | * | |||||||
| Lines | * | * | * | * | * | |||||||
| Lines with Circles | * | * | * | * | * | * | ||||||
| WKT / Shapes from Power BI data | * | * | ||||||||||
| Shapes from GeoJSON / shp files | * | * | ? | |||||||||
| Vector Tiles | * | * | ||||||||||
| ArcGIS Feature Layers | * | * |
Daylight Date & Time and Tooltips do not impact which data layers are displayed.
Controlling which layers are displayed using Power BI slicers
As which layers are displayed is based on the configuration of the data fields, it's possible to use a Power BI slicer to determine which shapes are displayed.
This table of data contains Well Known Text polygons and circles. The Well Known Text polygons represent either Health Areas or Local Authority Areas. The Circles represent the locations of clinics.
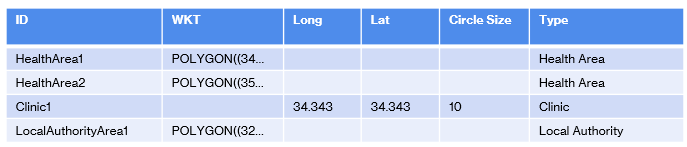
A slicer can be added to the report based on the Type field, which can then determine whether Health Areas, Clinics or Local Authority Areas are shown on the map, or a combination.
If the requirement is to either show Health Areas or Local Authority Areas and always show the clinics, then a separate table can be created with the slicer options. These are then joined to the table containing the map data with a join table as follows:
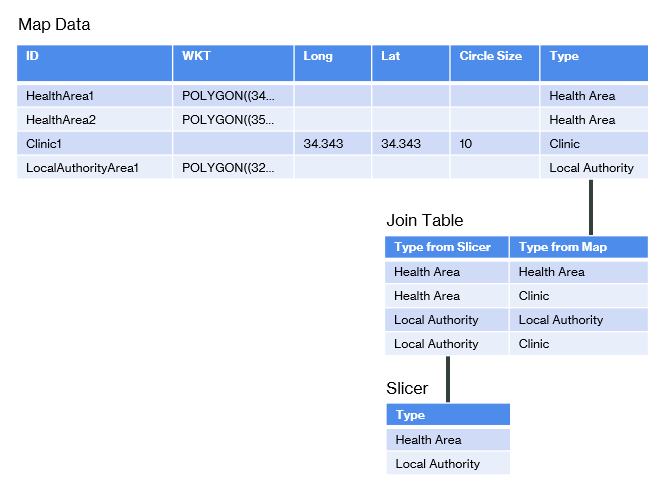
The slicer is now configured from the Type field in the Slicer table. The slicer should also be set to type "Single Select":
