WKT / GeoJSON from data
If you have a data source with geospatial data, such as SQL Server, PostgreSQL or Snowflake, then makes sense to load this data directly into your report via the Power BI semantic model. Icon Map Pro supports data in Well Known Text (WKT) and GeoJSON loaded from a field in your data.
Data setup
In order to display Well Known Text (WKT) or GeoJSON data from the Power BI data model, the following fields must be provided:
- ID - a unique Id representing that object
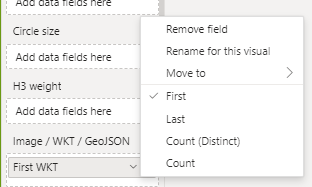
- Image / WKT / GeoJSON - the field or Measure containing your shape data. You may need to set the Aggregation type to "First" if your data is not coming from a measure.
Sample data
| ID | Longitude | Latitude | Destination Longitude | Destination Latitude | Circle Size | Cluster Group | H3 Weight | Heatmap Weight | Image / WKT / GeoJSON | Feature Reference | Feature Weight |
|---|---|---|---|---|---|---|---|---|---|---|---|
| WKT1 | null | null | null | null | null | null | null | null | POLYGON((30 10, 40 40, 20 40, 10 20, 30 10)) | null | null |
| GeoJSON1 | null | null | null | null | null | null | null | null | { "type": "Feature", "geometry": { "type": "LineString","coordinates": [[102.0, 0.0], [103.0, 1.0], [104.0, 0.0], [105.0, 1.0]] }} | null | null |
Configuration Options
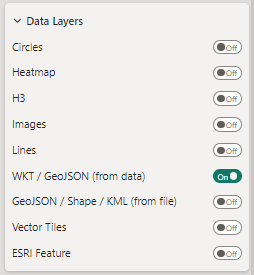
You will need to enable the "WKT / GeoJSON (from data)" toggle in the Data Layers formatting settings. Icon Map Pro will check to see if your data is an image or shape data and apply the appropriate settings.

Include in Auto Zoom
Whether the shape should be included in the auto zoom of the map. Can be set to yes or no using conditional formatting to apply to specific shapes.
Include Tooltip
Whether to include a tooltip. Can be set to yes or no using conditional formatting to apply to specific shapes.
Selectable
Whether the shape can be clicked on for interaction with other visuals. Can be set to yes or no using conditional formatting to apply to specific shapes.
Show Points As (WebGL Rendering Only)
This option determines how point data appears on the map.

There are 4 options to choose from:
- Pin - Shows a teardrop style map pin.
- Icon From Icon Library - Select from a range of built-in icons.
- Image - Provide the URL for a custom image.
- Circle - Draw circles representing the points.
Circle Size

If "Show Points As" is set to circle, this option allows you to select the size of the circles.
Icon Name
The name of the icon for when "Icon From Icon Library" is selected for "Show Points As"
Click the "Show Icon Library" toggle to show the Icon Library.
Image URL and Image Size
Allow you to set a custom image URL and size for points when "Image" is selected for "Show Points As"
Invisible Line Width
Creates an invisible line as well as the visible line when the width is greater than the visible width. A larger invisible width can help when clicking or hovering over narrow lines. Applies to objects of type linestring and multi-linestring.
Only available when WebGL rendering is enabled.
Polygon Extrusion Height
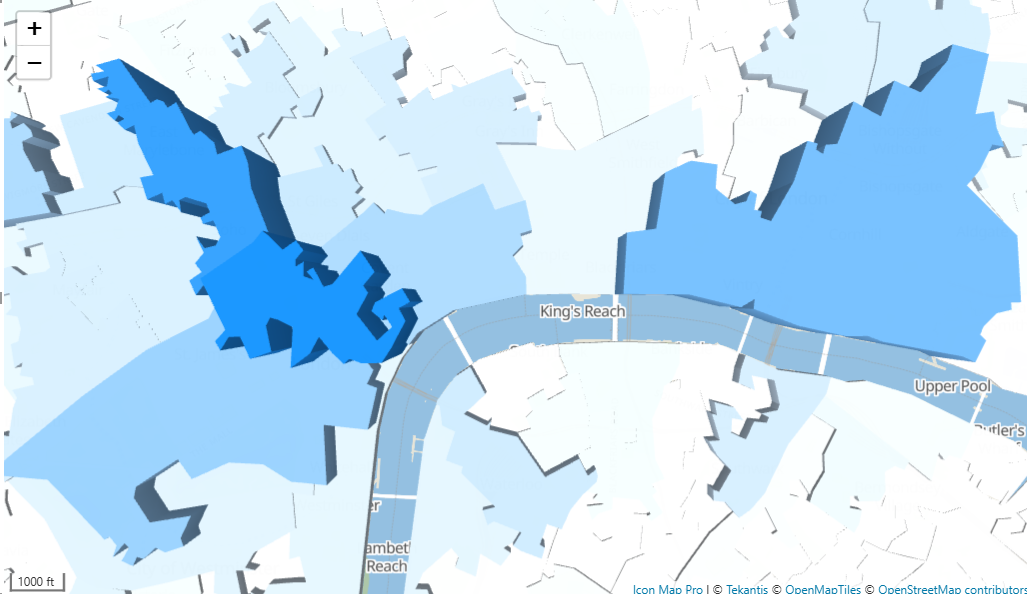
How many meters to extrude polygons from the map base.
Only available when WebGL rendering is enabled.
Image at the start / end of a linestring
If your shape is a linestring, then you can position an image at the start or end of the line, without having to add an additional row of data. This can be useful for drawing the history of vehicles, then drawing the current location of the vehicle.

The following settings are available to format the image:
Image URL at linestring start / end
The URL of the image. This can be hardcoded so that all lines display the same image, or use a DAX expression or field value for different images at each linestring end. URLs should start https or data. The same rules should be followed as other map images.
Image Rotation
This should represent a number between 0 and 359 and represents the number of degrees to rotate the image. This can be hardcoded, or set using conditional formatting from a DAX measure or field value.
Image Width and Height
These settings allow you to set the size of the image and represent the width and height in pixels. This can be hardcoded, or set using conditional formatting from a DAX measure or field value.
EPSG (Coordinate Reference System)
Allows you to specify a specific reference system for your coordinates. The default used is EPSG:4326 / WGS84 and expects longitude and latitude coordinates. You can use other coordinate systems by specifying the relevant EPSG number. For example, to use British National Grid coordinates, enter 27700. Other EPSG codes can be found here.

Minimum & Maximum Zoom
The zoom levels between which the layer should be shown.
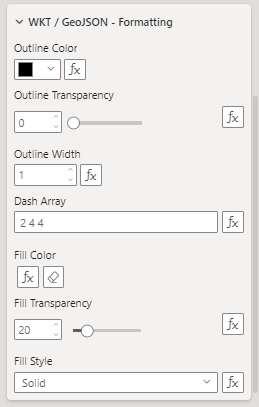
Formatting
The following options are available for WKT / GeoJSON shapes:
Color Type
Only available with WebGL Rendering
This option enables you to pick between solid colors, or a gradient color for lines and polygon outlines. When enabled, it is not possible to set the outline color using conditional formatting.
Outline color
The color of shape outlines or linestrings.
Outline transparency
Transparency shape outlines or linestrings. This should be a numeric value between 0 and 100.
Outline Width
Width of the outline in pixels. Can be a decimal number.
Dash Array
The dash array determines the pattern used for the line. It consists of a series of space separated numbers. Each value represents the length along the line that should be painted (the dash) and then not painted (the gap). Eg:
4 4
Not available with WebGL rendering
Dash Animation Speed
If a dash array is used to draw a line pattern, it can be animated to show the direction of travel. The speed can be a negative or positive number, such as 10.
Not available with WebGL rendering
Fill Color
Fill color of a shape.
Fill Transparency
Transparency of the fill of a shape.
Fill Style

Whether the shape is solid, hatched or pattern (WebGL rendering only)
When pattern is selected, the following options are available:
Pattern / Image URL.
Specify the the URL of a custom image to use as the fill:

or click the "Show Pattern Library" toggle to select from in-built patterns:

When hatched is selected, the following additional options are available:

Hatch Angle
The angle of the lines forming the hatched fill.
Hatched Width
The width of the lines forming the hatched fill.
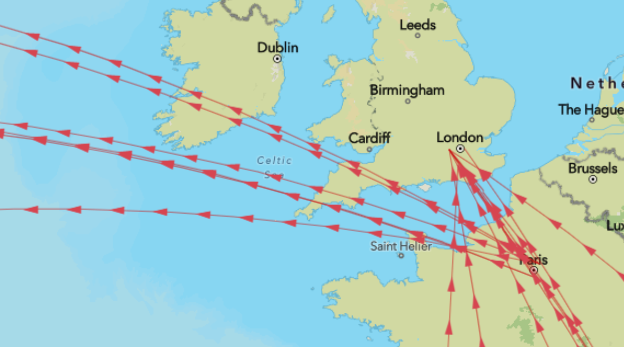
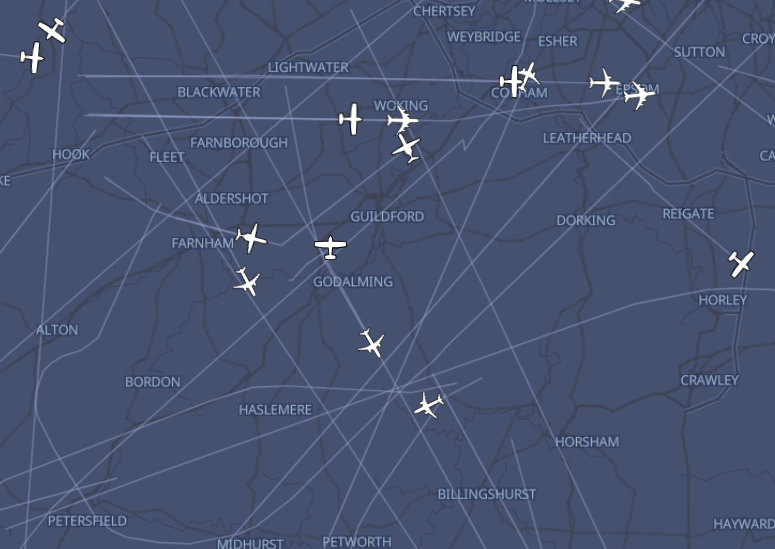
Line Symbols
It is possible to add a symbol along the path of a LineString or MultiLineString.
Include Line Symbol
Determines whether symbols are displayed. Can be set using conditional formatting values "yes" or "no" to determine the setting for each individual line.
Line Symbol Text
The text/symbol that is drawn along the line. Use Unicode Characters to draw symbols such as planes, arrows etc. Symbols should face towards the right to show in the direction of the line. Use spaces to determine the gaps between. This setting can be determined using conditional formatting to show different text or a different symbol for each line.
Line Symbol Color
Set the color of the symbol or text.
Line Symbol Size
Set the size of the symbol/text in pixels
Line Symbol Orientation
This determines how the symbols are drawn:
- Normal - oriented along the direction of the line
- Flipped - rotated by 180 degrees
- Perpendicular - rotated by 90 degrees
Line Symbol Offset
Ensure your symbols are aligned to the center of the line, or offset below or above. This value can be a negative number to draw text above the line.
Not available with WebGL Rendering
Line Symbol Repeat
Determines whether one symbol is shown, or multiple. Can be set using conditional formatting using the values "yes" or "no".
Symbol Halo Color
Only available with WebGL rendering
The color of the symbol text outline
Symbol Halo Width
Only available with WebGL rendering
The width of the halo
Symbol Halo Blur
Only available with WebGL rendering
How much the halo is blurred
Dealing with Power BI's column width limits
When loading data into a Power BI semantic model there are limits on the maximum number of characters that can be loaded. Text fields in Power BI are limited to 32766 characters. Often WKT or GeoJSON shapes can be truncated, and therefore not display in your map. There are a number of strategies that you can take to reduce the size of your shapes:
-
Reduce the decimal precision of your shapes. Often you don't need to store longitude and latitude coordinates within your shapes with large numbers of decimal places. Reducing these can cause a significant reduction in the number of characters. PostgreSQL has a built-in function for performing this, ST_ReducePrecision.
-
Reduce the number of points in your polygons and linestrings. Tools such as QGIS have inbuilt capabilities if working with shape files, or if using databases such as SQL Server or PostgreSQL, then you could consider the inbuilt spatial functions such as: ST_Simplify or ST_SimplifyPreserveTopology with PostgreSQL, or Reduce with Microsoft SQL Server.
If your shapes are still too large, then splitting the shapes into multiple rows or columns and then creating a DAX measure to combine them back together will work for shapes up to around a million characters.
Check out the Working with shapes from databases page for detailed examples.
Caution when using Direct Lake or Microsoft Fabric's Data Warehouse
Whilst PowerQuery and Power BI support up to 32766 characters in a column, this limit is severely reduced in Microsoft Fabric's Synapse Data Warehouse with support for only 8000 characters. WKT or GeoJSON data will need to be split before being stored in the data warehouse.
This 8000 character is also a limit, even if you are not using the Data Warehouse, and instead have Semantic Models using Microsoft Fabric's Direct Lake mode to connect to your data. Whilst Direct Lake supports 32766 characters, if your connection falls back to DirectQuery, then your data will be truncated to 8000 characters as it then uses the SQL endpoint. To mitigate this, you will need to split your shapes at 8000 characters, not 32766.
Generating linestrings from multiple rows of point data
If you have a series of longitude and latitude points on multiple rows, it is possible to concatenate these into a single linestring using DAX. This is useful if you have a series of vehicle locations over time and want to create a single track on the map for that vehicle, perhaps adding an image for the vehicle at its latest location.
Based on the following table of data representing the tracks of two vehicles:
| vehicleID | longitude | latitude | timestamp |
|---|---|---|---|
| vehicle 1 | -0.93 | 51.34 | 2025-05-29T10:10 |
| vehicle 1 | -0.94 | 51.34 | 2025-05-29T10:12 |
| vehicle 1 | -0.94 | 51.35 | 2025-05-29T10:13 |
| vehicle 2 | -0.81 | 52.01 | 2025-05-29T10:09 |
| vehicle 3 | -0.84 | 52.00 | 2025-05-29T10:11 |
and the following DAX measure:
VehicleTrack =
    "LINESTRING ("
        & CALCULATE (
            CONCATENATEX (
                'TableName',
                'TableName'[longitude] & " " & 'TableName'[latitude],
                ",",
                'TableName'[timestamp], DESC
            ) & ")"
        )
Adding the vehicleID field to Icon Map Pro's ID field well, and the new VehicleTrack measure to the Image / WKT / GeoJSON field well, will result in the following WKT being generated:
| vehicleID | VehicleTrack |
|---|---|
| vehicle 1 | LINESTRING (-0.93 51.34,-0.94 51.34,-0.94 51.35) |
| vehicle 2 | LINESTRING (-0.81 52.01,-0.84 52.00) |
DirectQuery and Composite Models for large geospatial datasets
If you have a large number of geospatial data, it may become impractical to import it into your Power BI dataset. You could consider setting a DirectQuery connection for the table holding your spatial data. In that way it requested only when it is needed to display on the map.
To maintain performance with the rest of your report, you could consider a composite model where your spatial data table is in Direct Query mode and the rest of the semantic model is in import mode.