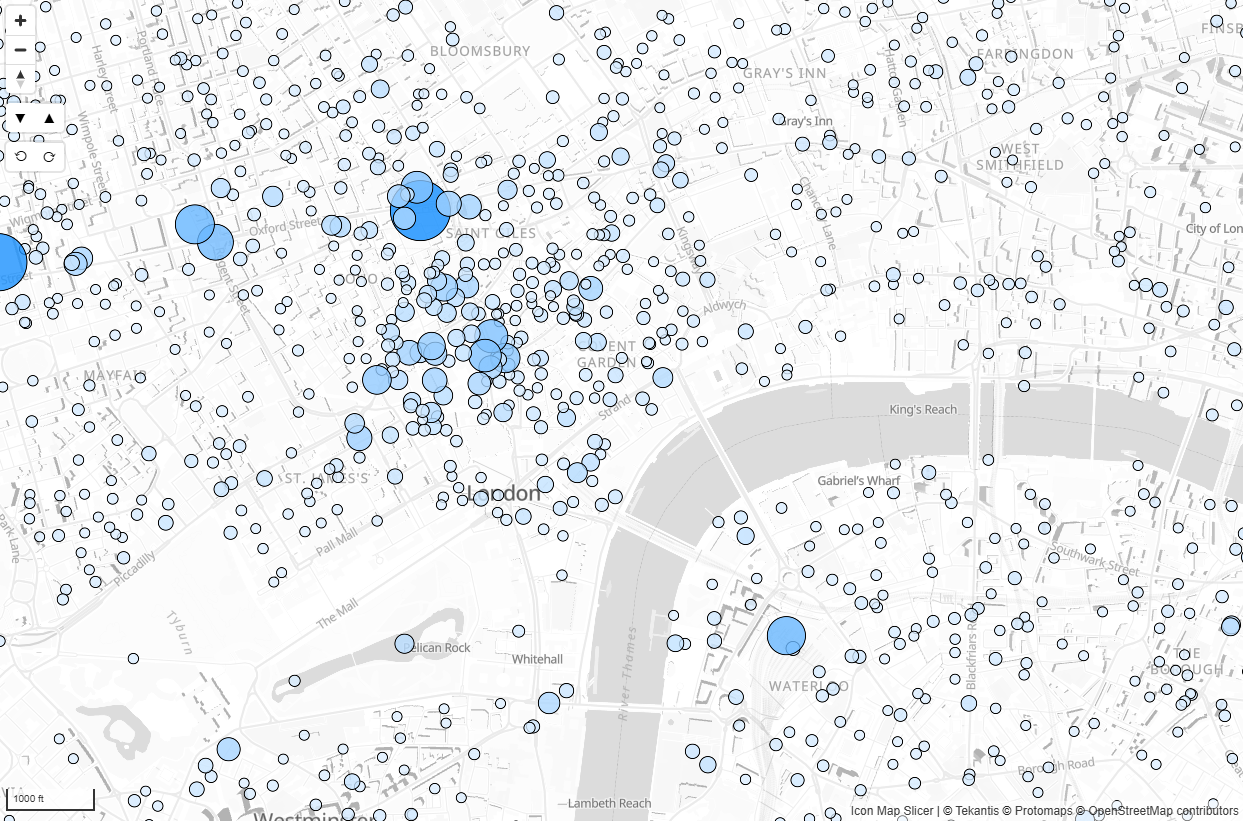
Circles
Icon Map Slicer provides the ability to draw circles on the map.
Data configuration
To draw circles, the following fields must be configured:
- ID – A unique ID representing that location. This field can contain more than one value to generate a drill-down hierarchy.
- Longitude (with aggregation type Average)
- Latitude (with aggregation type Average)
- Circle Size – A numeric value determining what size to draw the circle.
Circles – Configuration
In the Data Layers card of the formatting options, ensure that "Circles" is enabled. This will then show the Circles – Configuration and Circles – Formatting cards.
Size Behaviour
Determines how the circle size is calculated:
- Relative – The circles will be drawn between the Minimum Size and Maximum Size options. The lowest value in the dataset will be minimum size, and the highest value will be the maximum size, with values scaled in between.
- Size in pixels – The circles will be drawn with a fixed diameter in pixels based on the value in the size field. They will appear to stay the same size as the map zooms in and out.
- Size in meters – The circles will be drawn with a diameter in meters on the map, based on the value in the size field. They will appear to change size relative to zoom.
Minimum Size / Maximum Size
For Relative sizing, these values set the minimum and maximum circle diameter in pixels.
Pitch Alignment
Determines whether the circles are aligned to the Viewport (fixed relative to the screen) or the Map (tilt with the map pitch).
Pitch Scale
Determines how circles scale when the map is pitched:
- Map – Circles scale to remain proportional to the map.
- Viewport – Circles scale relative to the screen.
Include in Auto Zoom
Whether these circles are included when the auto zoom function is used. Auto zoom adjusts the map view to fit all visible items with this option enabled. Supports conditional formatting.
Include Tooltip
Whether to display a Power BI tooltip when hovering over the circle. Supports conditional formatting.
Selectable
Whether the circle can be selected to filter or cross-highlight other visuals, or to trigger drill-down or drill-through functionality. Supports conditional formatting.
Z-Index
Determines the drawing order relative to other layers. Higher numbers are drawn above lower numbers.
Minimum Zoom / Maximum Zoom
The zoom levels at which circles appear or disappear.
EPSG (Coordinate Reference System)
Specifies the coordinate reference system of your data. The default is 4326 (WGS84 – longitude and latitude). Other EPSG codes can be used, such as 27700 for British National Grid. EPSG codes reference.
Circles – Formatting
These options control the appearance of circles. All can be set using Power BI conditional formatting.
Outline
- Outline Color – Colour of the circle outline.
- Outline Transparency – 0 to 100, where 0 is fully opaque.
- Outline Width – Outline width in pixels.
Fill
- Fill Color – Colour of the circle fill.
- Fill Transparency – 0 to 100, where 0 is fully opaque.
- Blur – Blurs the edge of the circle by the given pixel amount.