Guide to creating PMTiles

Vector tiles unlock all sorts of possibilities in Icon Map Pro as they allow us to place complex lines and polygons on the map without having to load large files into the report. This means we're not as constrained by the amount of memory we have to play with as a Power BI custom visual - and therefore we can load more data into the visual as a result - we only need to send 2 columns of data to the visual, plus the formatting options.
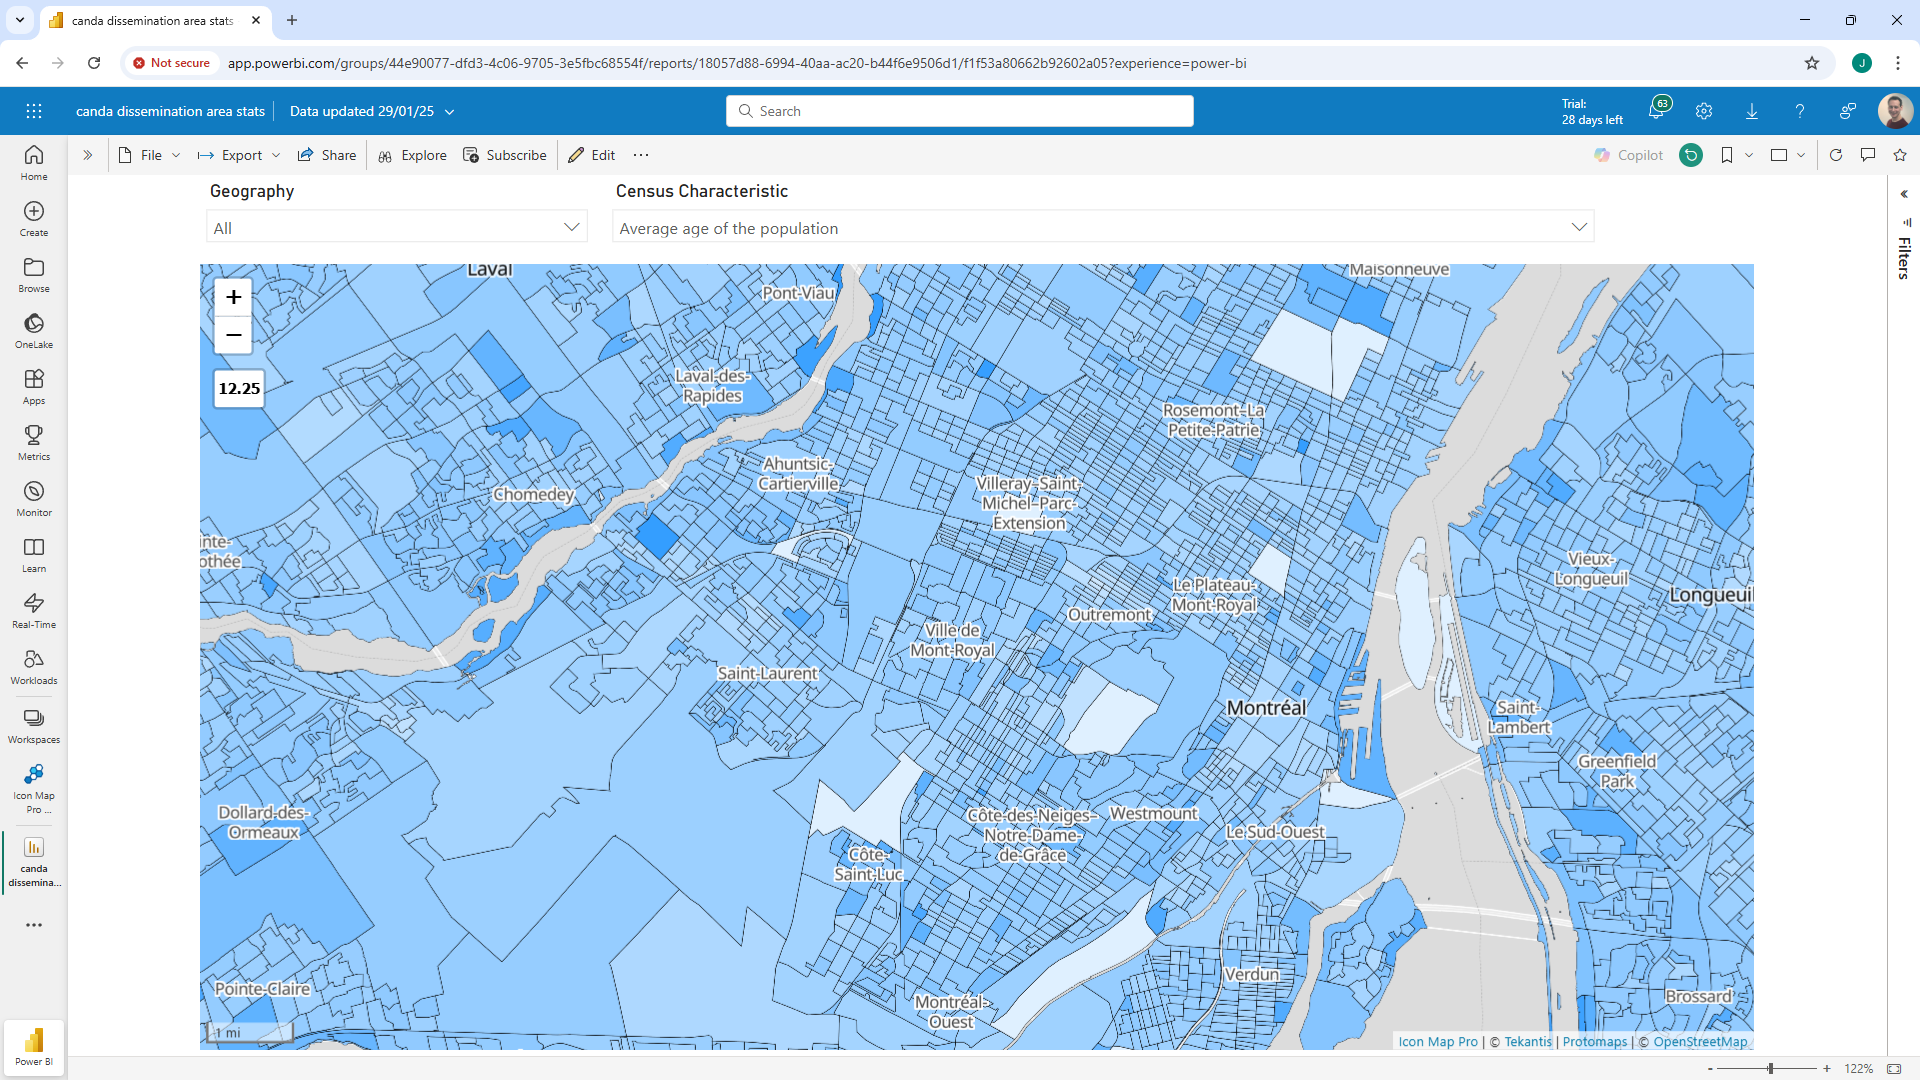
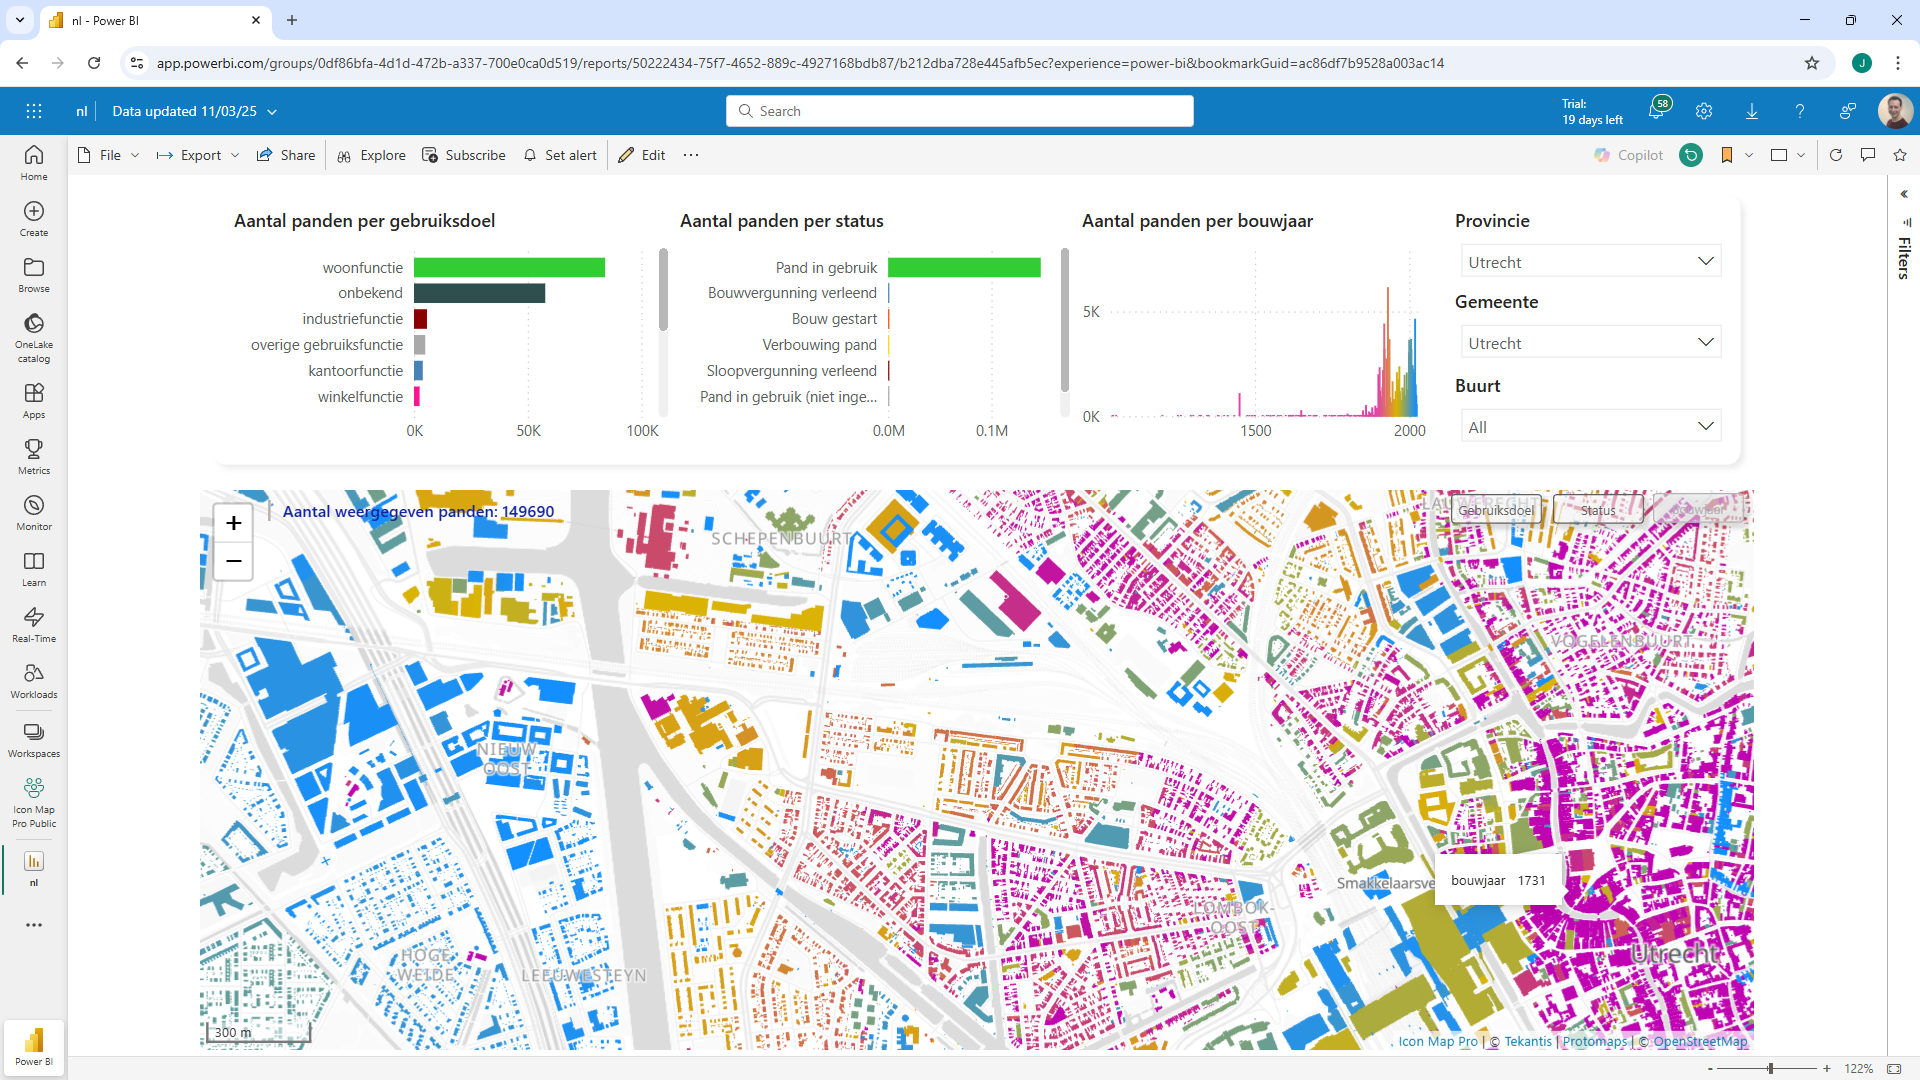
For example this report contains the details of all 11 million properties in the Netherlands, and we can reference nearly half a million of them at a time on the map, setting the formatting options based on data in the Power BI dataset.
The challenge has been with vector tiles, is that they need to be generated and hosted somewhere - usually requiring a GIS server such as ArcGIS, GeoServer or a SaaS service such as Mapbox, which may charge by transaction or require setup and hosting. PMTiles however is a cloud-native geospatial format that enables the tiles to be held in a single file which can be hosted in simple cloud storage such as Azure blob storage or an AWS S3 bucket. These are generally cheap storage options, and have no compute cost associated with them.
So how do we go about creating PMTiles? In the coming months, at Tekantis, we'll launch an Azure and/or Microsoft Fabric service to generate them, but in the meantime there are open source tools we can use.
This guide goes through the process of setting up and using the tools for the first time.
The source data
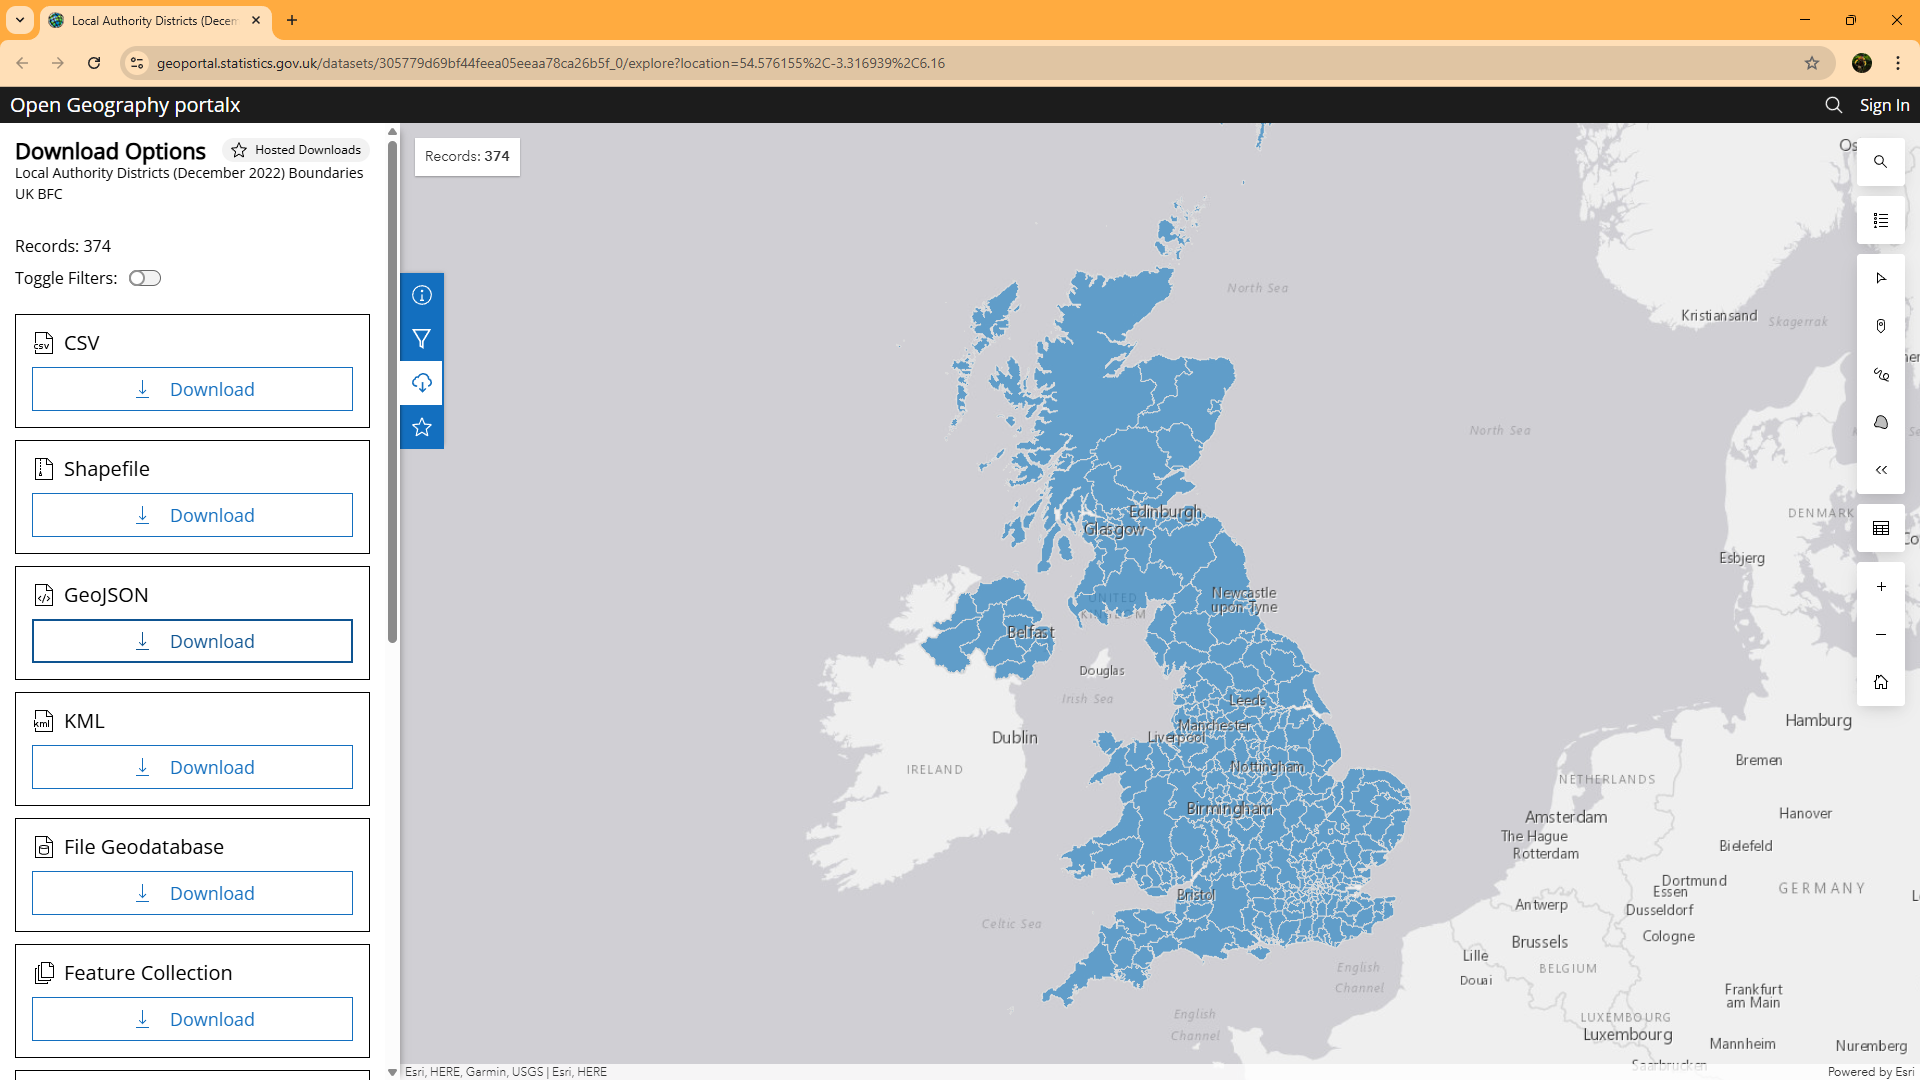
We're going to use the UK's local authority boundaries as our source data. These are obtained from the Office for National Statistics' Geoportal. You'll see me use these files a lot in demos and there are number of options for each file.
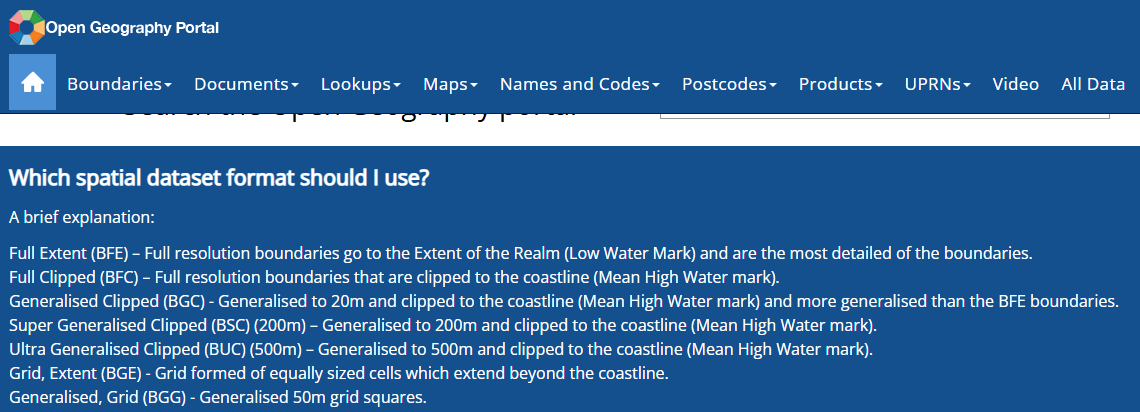
Often I'm loading them as Esri shape files into the visual, so I'll chose the "generalised clipped" version, which Icon Map Pro will go on to further simplify. The challenge with that is that by simplifying the boundaries we lose some of the detail. For example, where I live, the local authority boundary runs down the centre of the road, and depending on which side of the road you live, children are eligible for free school transport - or not - as the different local authorities have different eligibility criteria. Therefore for this example I'm going to download the full clipped version and download it in GeoJSON format - which will already be using Longitude and Latitude coordinates, rather than British National Grid coordinates. This file is over 190mb, so far too large to upload into the visual without using vector tiles, but it has the most amount of detail - ensuring that those precise boundaries are preserved.
Install Tippecanoe
I've found the best tool for creating vector tiles is Tippecanoe - originally created by Mapbox. Recently Felt created a fork of Tippecanoe that natively supports PMTile generation.
For Power BI developers who will be typically using a PC, Tippecanoe an causes an issue as it doesn't run on Windows - it runs on OSX or Linux.
It is possible to run Linux alongside Windows using the Windows Subsystem for Linux (WSL). Microsoft have a comprehensive guide to setup, but here's the short version:
Run cmd or Powershell as administrator (Press the Windows key and R, type cmd and right click on Command Shell. Then select 'Run as Administrator').
Then within the command shell, type
wsl --install
This will install Linux using the Ubuntu distribution:
Once installed, start Linux and we're ready to install Tippecanoe.
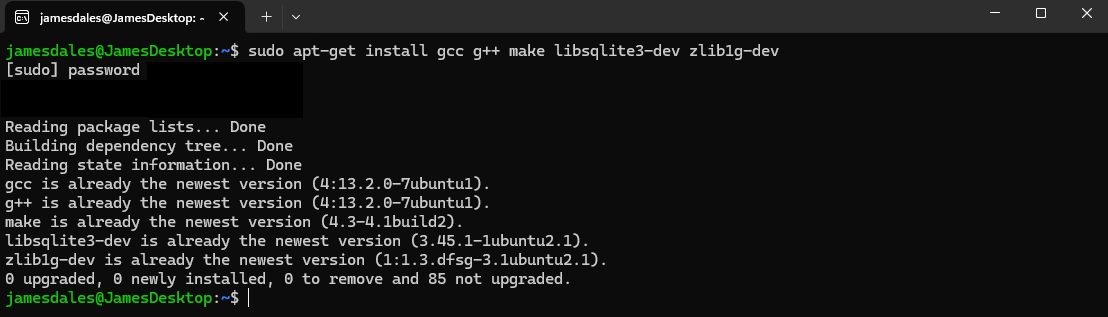
First though we need to update the compiler:
sudo apt-get install gcc g++ make libsqlite3-dev zlib1g-dev
then
make
then
make install
With that done we can now install Tippecanoe:
$ git clone https://github.com/felt/tippecanoe.git
$ cd tippecanoe
$ make -j
$ make install
The good news is, you don't need to do these steps again!
Generate the PMTiles file
Now we have all the prerequisites installed we can create our tiles. We can copy our geojson file from the downloads folder into the Linux file system. In windows explorer (Windows key and e) enter \\wsl$.

This will show the linux file system.
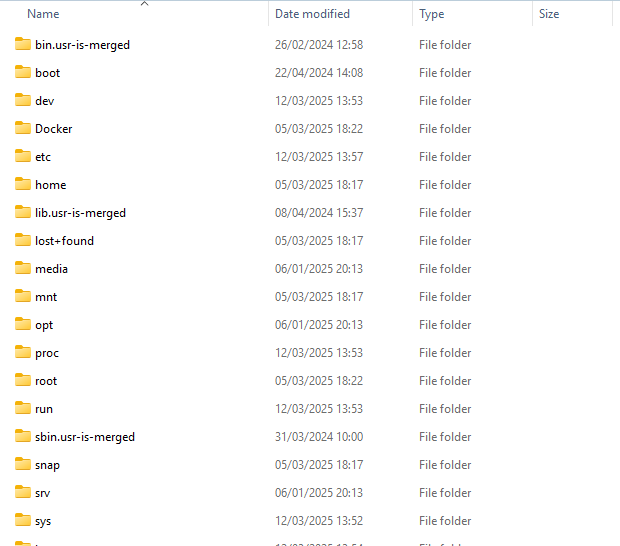
Navigate to the home directory, then the folder for your user name, and then tippecanoe.
Copy your file here.
Back in Linux, we're ready to run Tippecanoe. We're going to create a file called localauthorities.pmtiles in a layer named lad using our source file Local_Authority_Districts_December_2022_UK_BFC_V2.geojson
Run the following command:
tippecanoe -zg --projection=EPSG:4326 -o localauthorities.pmtiles -l lad Local_Authority_Districts_December_2022_UK_BFC_V2.geojson
Tippecanoe will now process the file and generate the PMTiles output file.

Back in windows explorer you should be able to see the newly generated file. You may need to press F5 to refresh Windows Explorer:

You'll notice that the generated file is around 15mb, 175mb smaller than the original.
Hosting the file
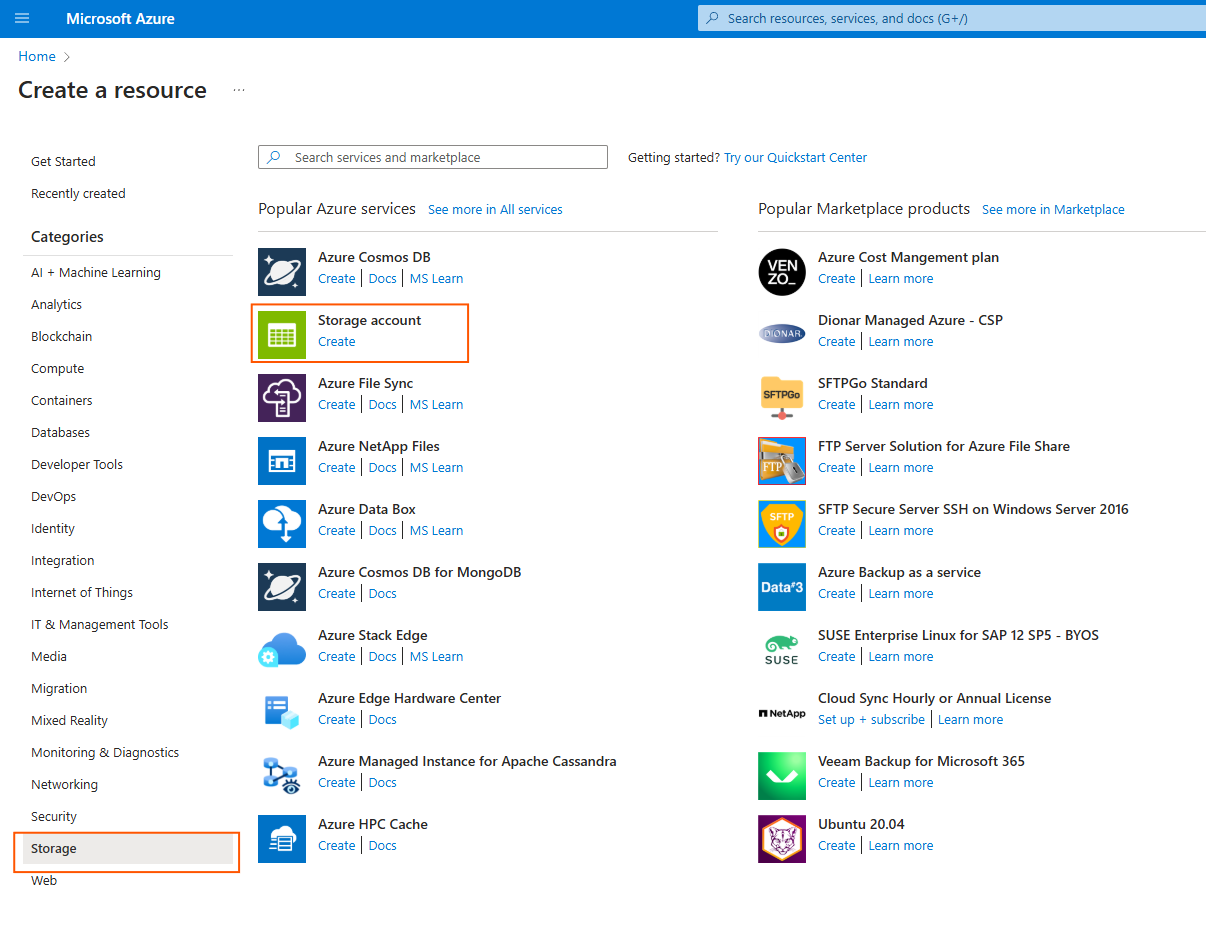
Now we've generated the PMTiles file we need to host it somewhere. I'm going to use Azure Storage.
You can create a new Storage Account by clicking the new button in the Azure portal:
Provide a name for the storage account, and the remaining options should work as the defaults.
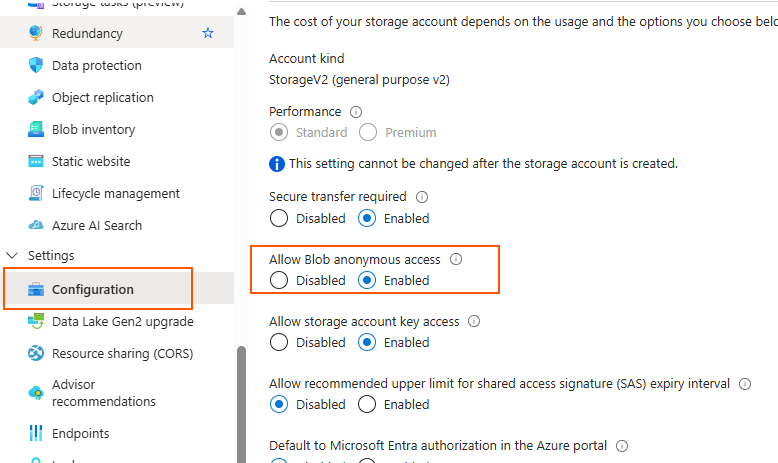
Once created we need to configure a couple of bits.
Firstly enable anonymous access to the blobs. (It is possible to configure secured access via SAS tokens)
And then configure CORS:
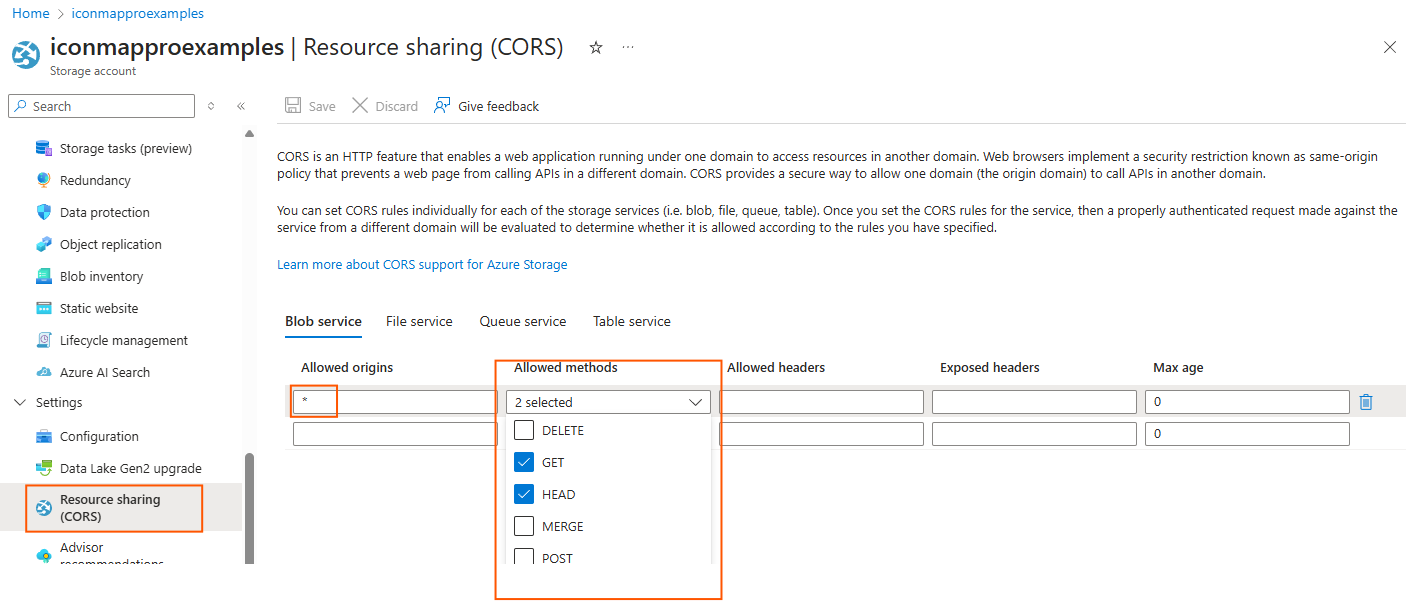
Create a row with Allowed origins set to * and the Allowed Methods set to "Get" and "Head".
Save these settings.
Now you can create a container to store the PMTiles file:
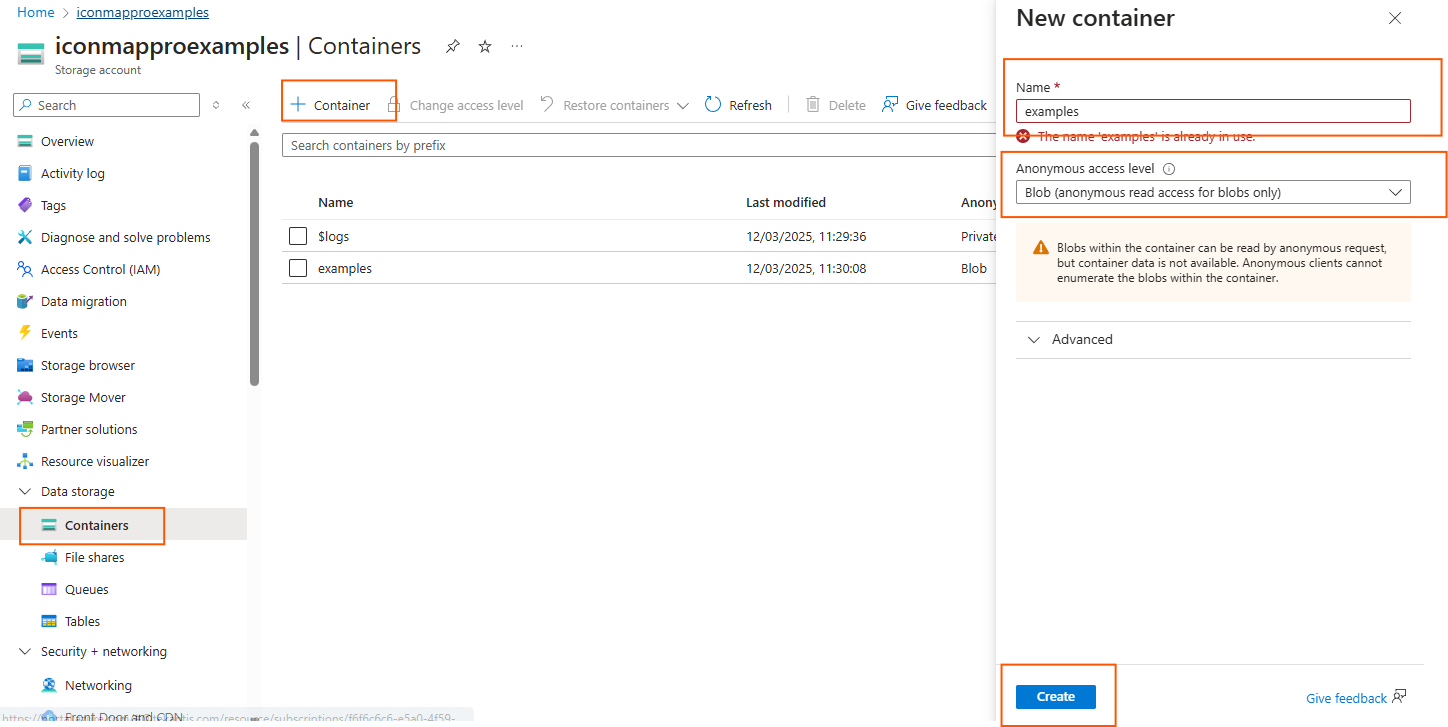
Click on the container to enter it.
Click the upload button to upload the PMTiles. Remember you can type \\wsl$ to navigate to the linux file system. Your file will be in home\username\tippecanoe
Once uploaded, click on it and copy the URL:
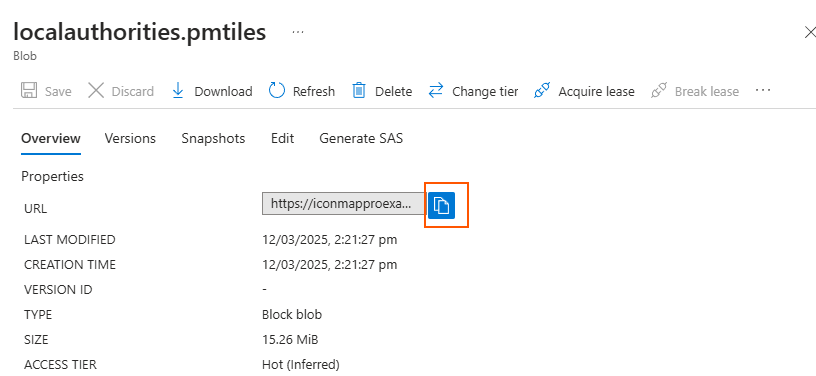
In my case the URL is:
https://iconmapproexamples.blob.core.windows.net/examples/localauthorities.pmtiles
Check the layer has worked
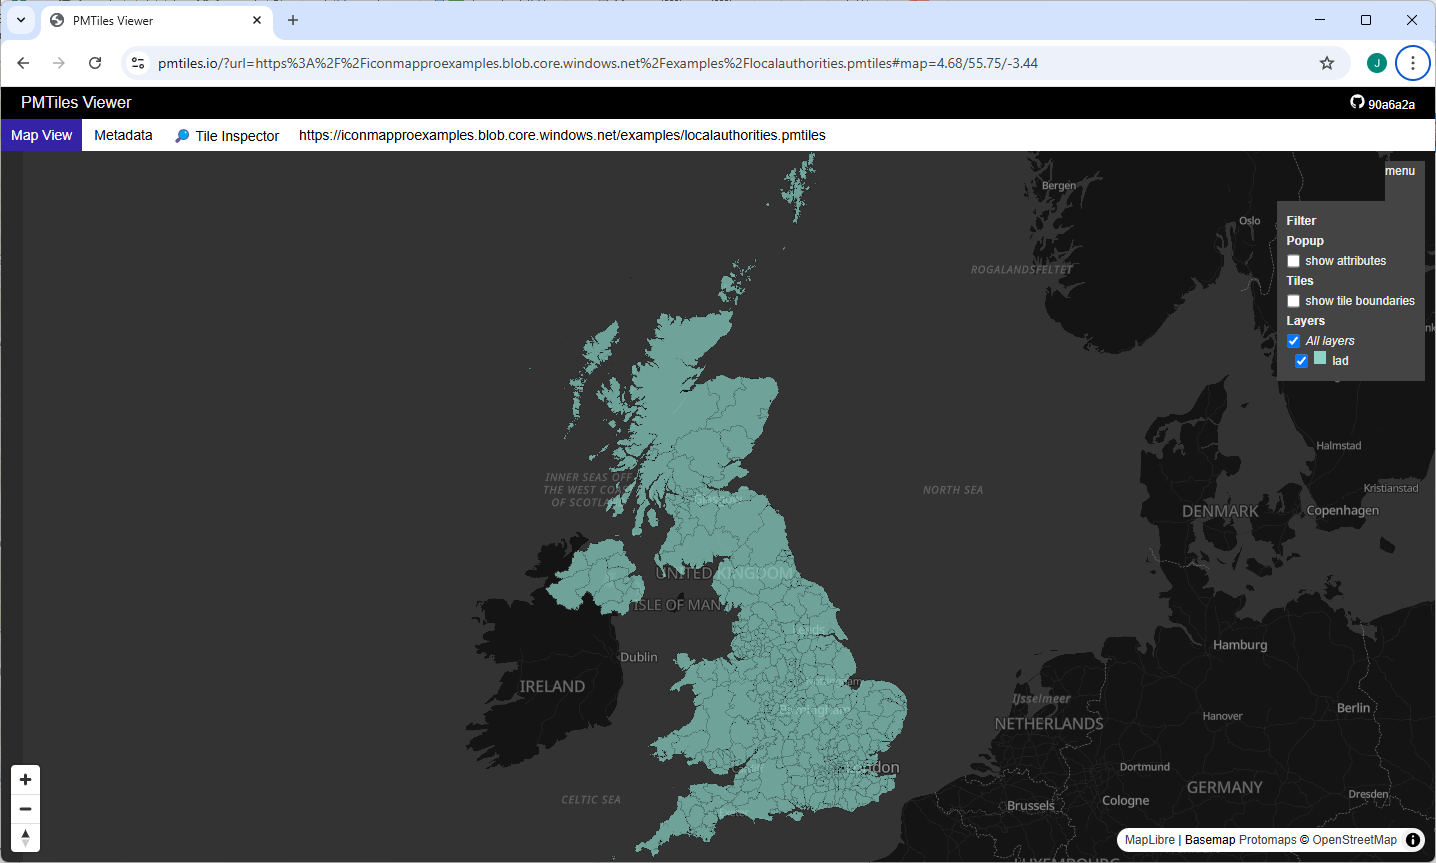
We can use the PMTiles Viewer tool to check that it has worked.
Navigate to https://pmtiles.io/ in your browser
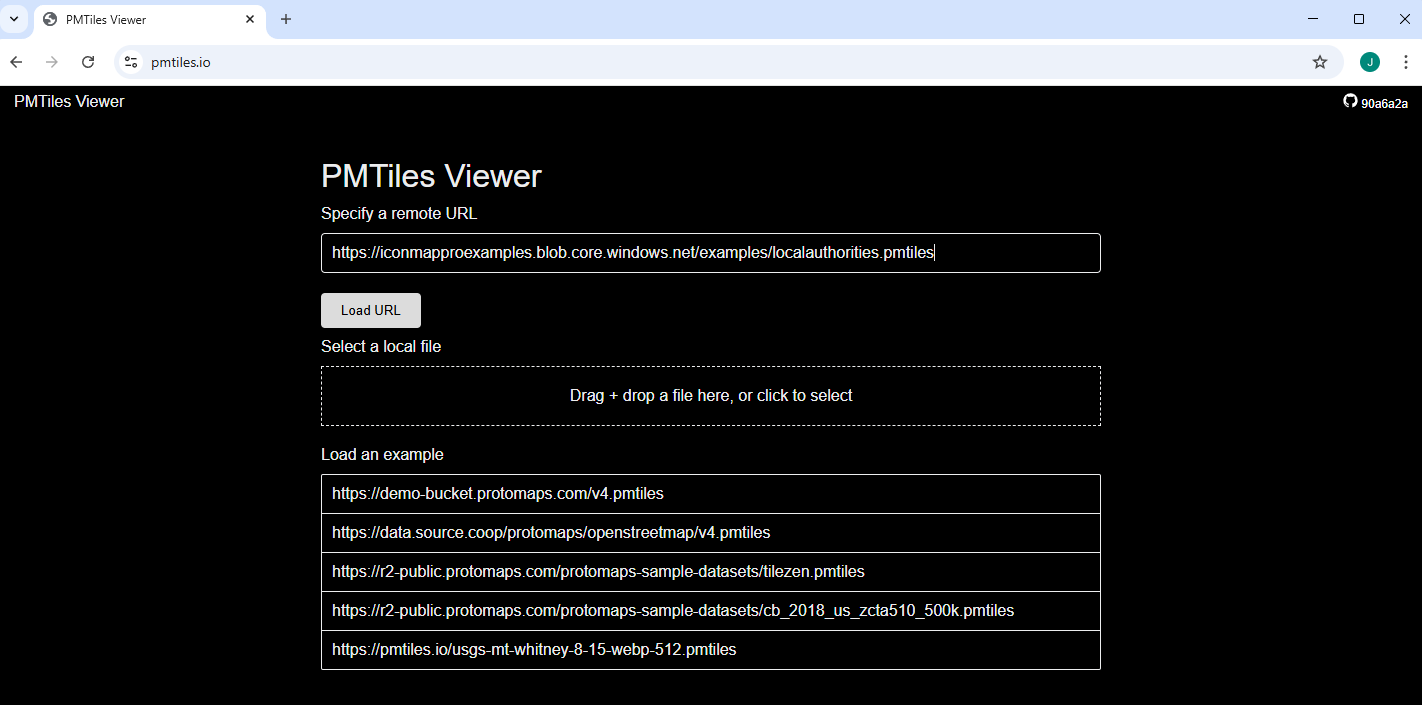
and paste in your URL and hit Load URL.
You should now see your layer displayed:
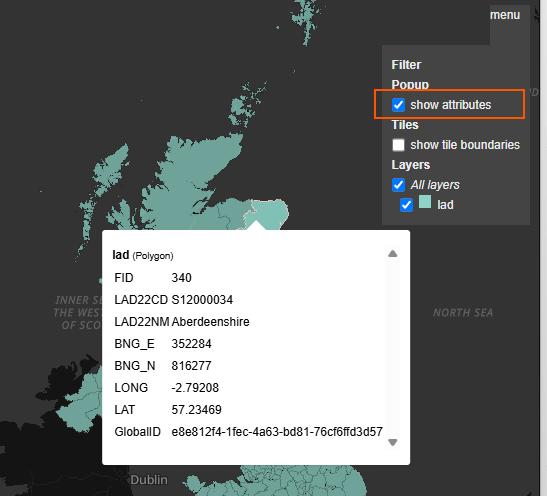
Enabling "show attributes" enables you to see the properties related to each shape as you mouse over them.
Use the PMTiles layer in Power BI
Now in Power BI Desktop, add Icon Map Pro to your report canvas.
I have a dataset with the local authority codes and names in it - these match those from the original GeoJSON file.
I've dragged the code field into both the ID and Feature Reference fields in Icon Map Pro:
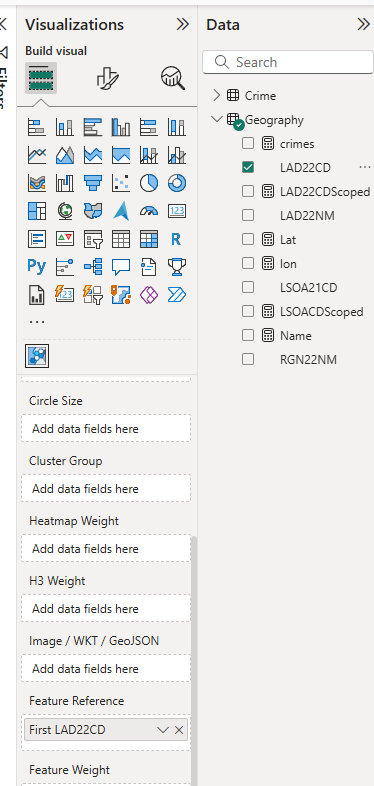
This will be used to create the join between the Power BI data and the properties in the vector tile layer.
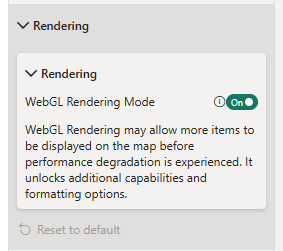
Now in the settings, firstly enable WebGL Rendering. PMTiles are only available with this enabled.
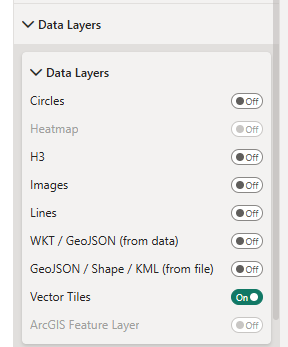
Enable Vector Tiles in Data Layers:
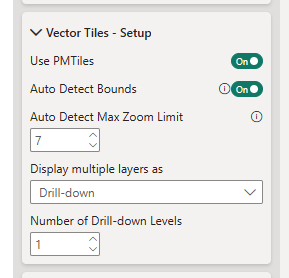
In Vector Tiles - Setup, enable 'Use PMTiles' and 'Auto Detect Bounds'
Paste in the URL of the PMTiles layer:
https://iconmapproexamples.blob.core.windows.net/examples/localauthorities.pmtiles

Your report should now show the layer. Shapes that have matched the Power BI data will be shown in blue. Those that have not been matched to Power BI data will show in grey:
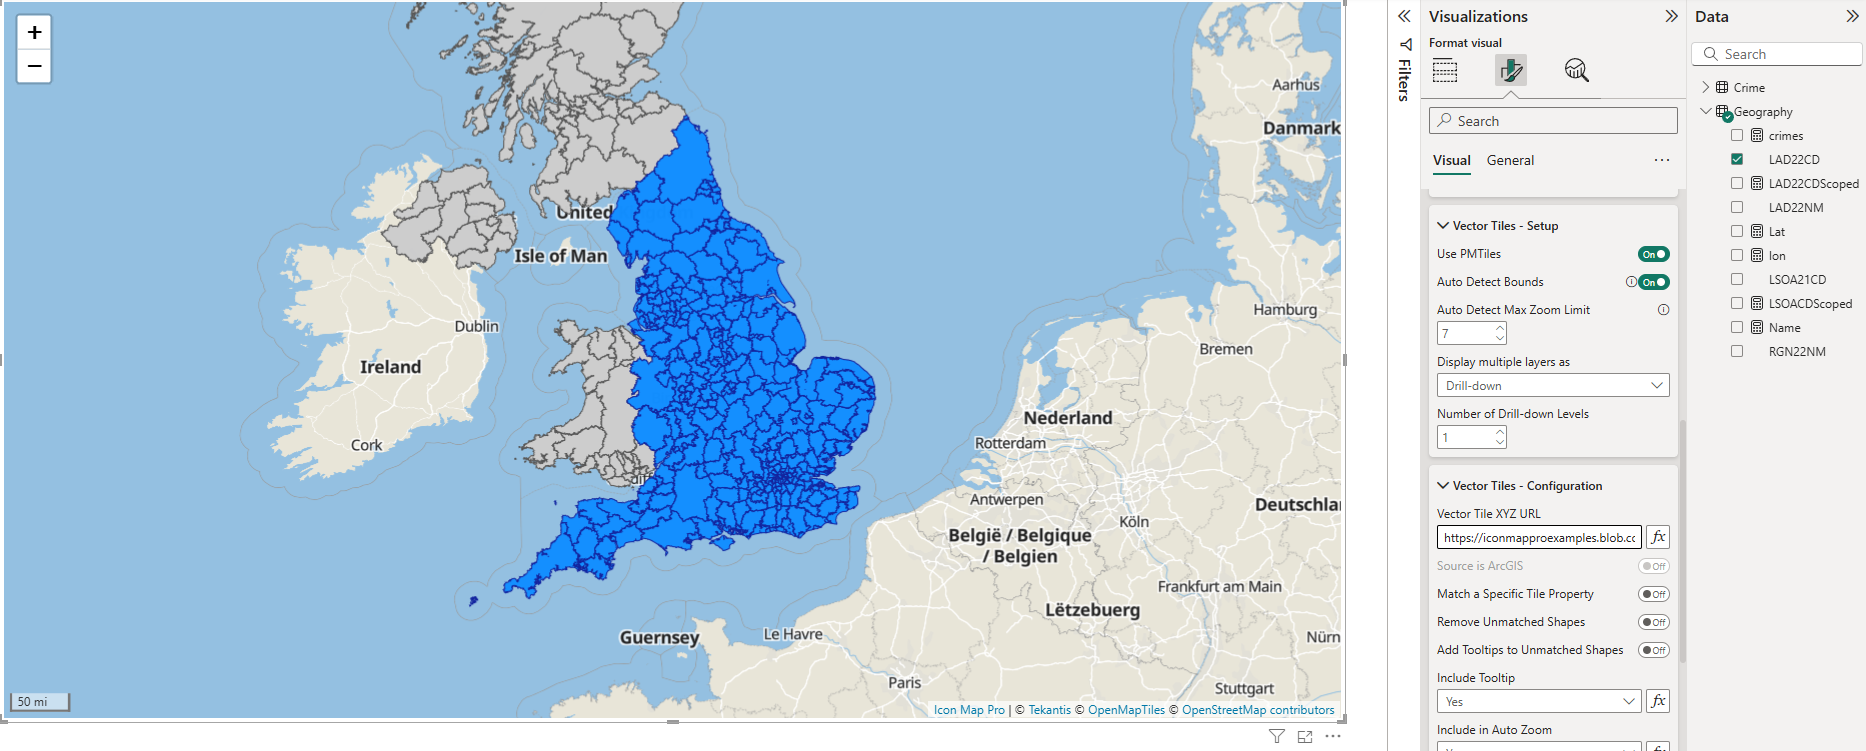
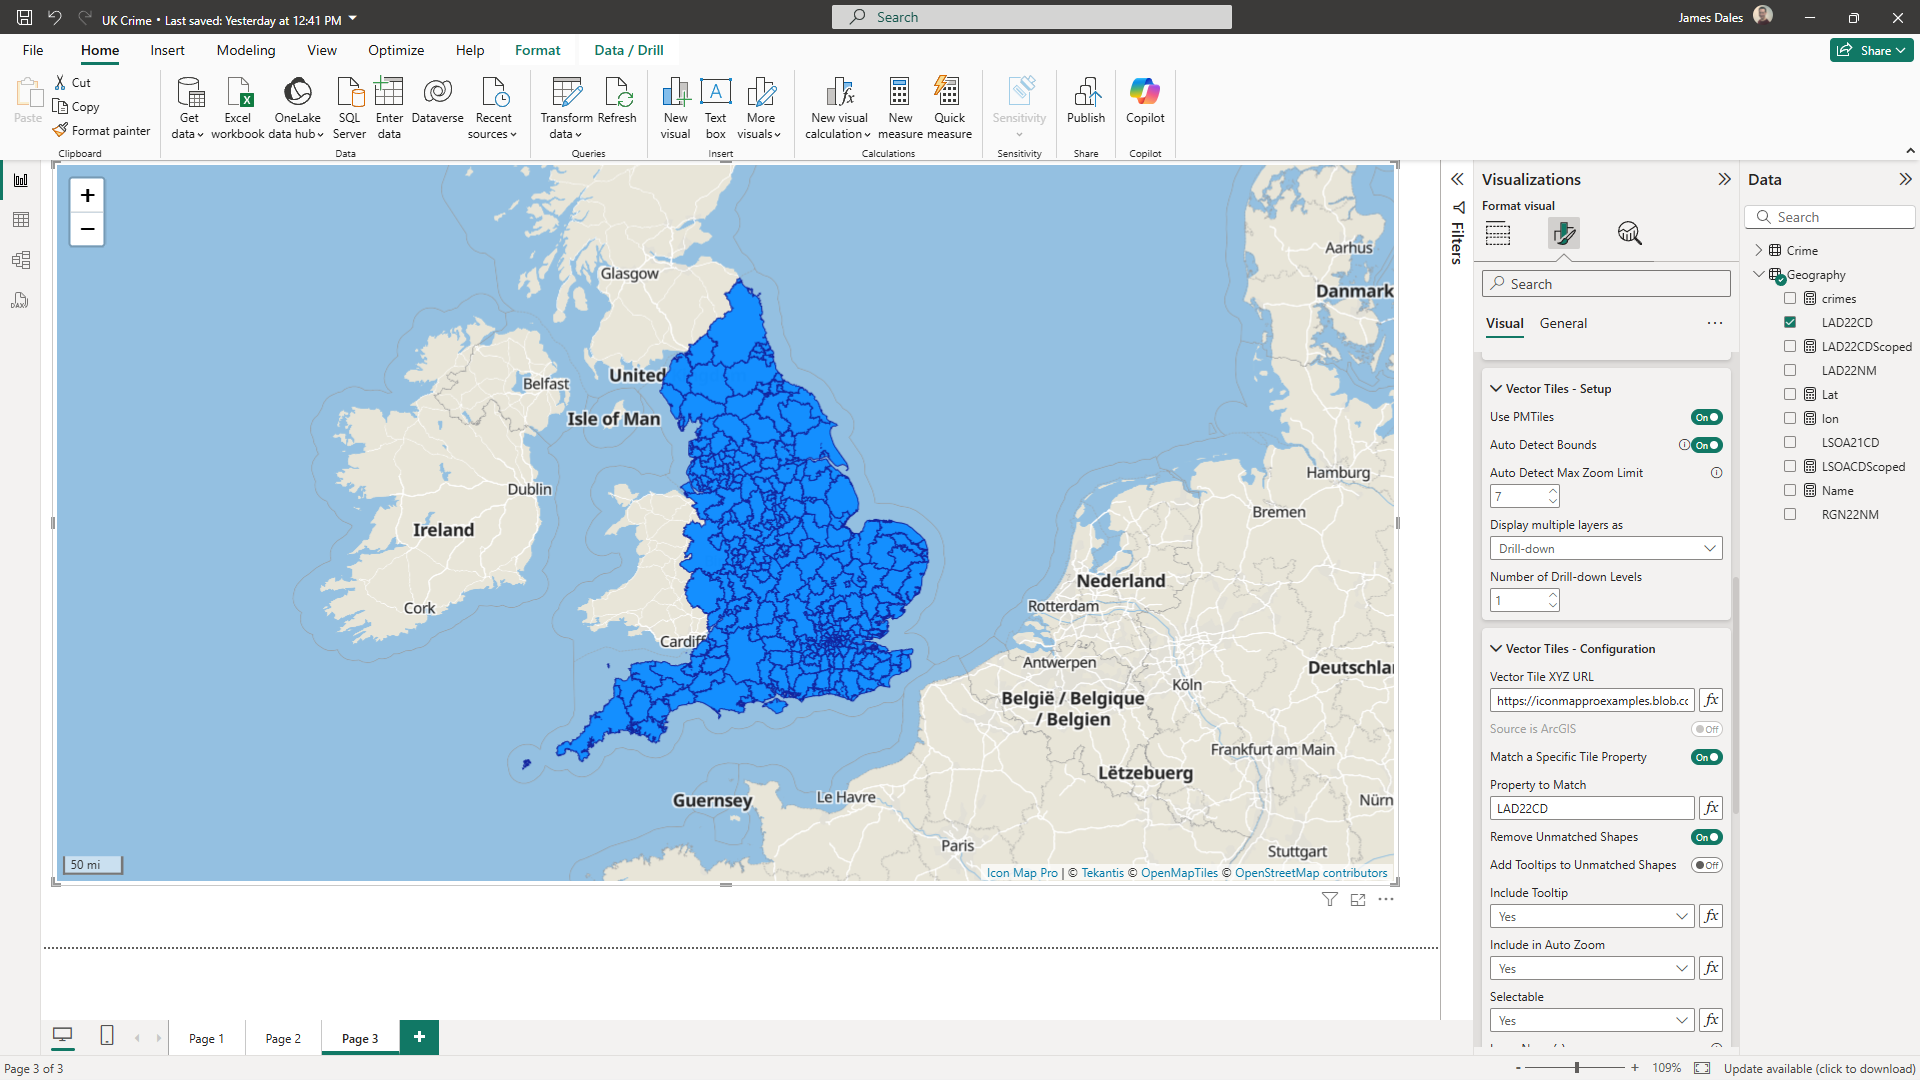
Icon Map Pro will attempt to join the Power BI data using the data in the Feature Reference field. It tries to match the values here against the values in each of the properties in the vector tile layer's shapes. This can sometimes generate false positives, so you may want to specify a specific property to match against:

I've also chosen here to remove features that haven't been matched, so the grey shapes are not shown.
You can now go ahead and apply conditional formatting as normal to format the shapes.
Additional notes
You may find that when generating small shapes, these aren't shown correctly at low zoom levels. There is guidance on how to deal with thin within the documentation.
I thoroughly recommend reading more on PMTiles concepts and background.
Kudos and full credit to Brandon Liu for developing the PMTiles format.