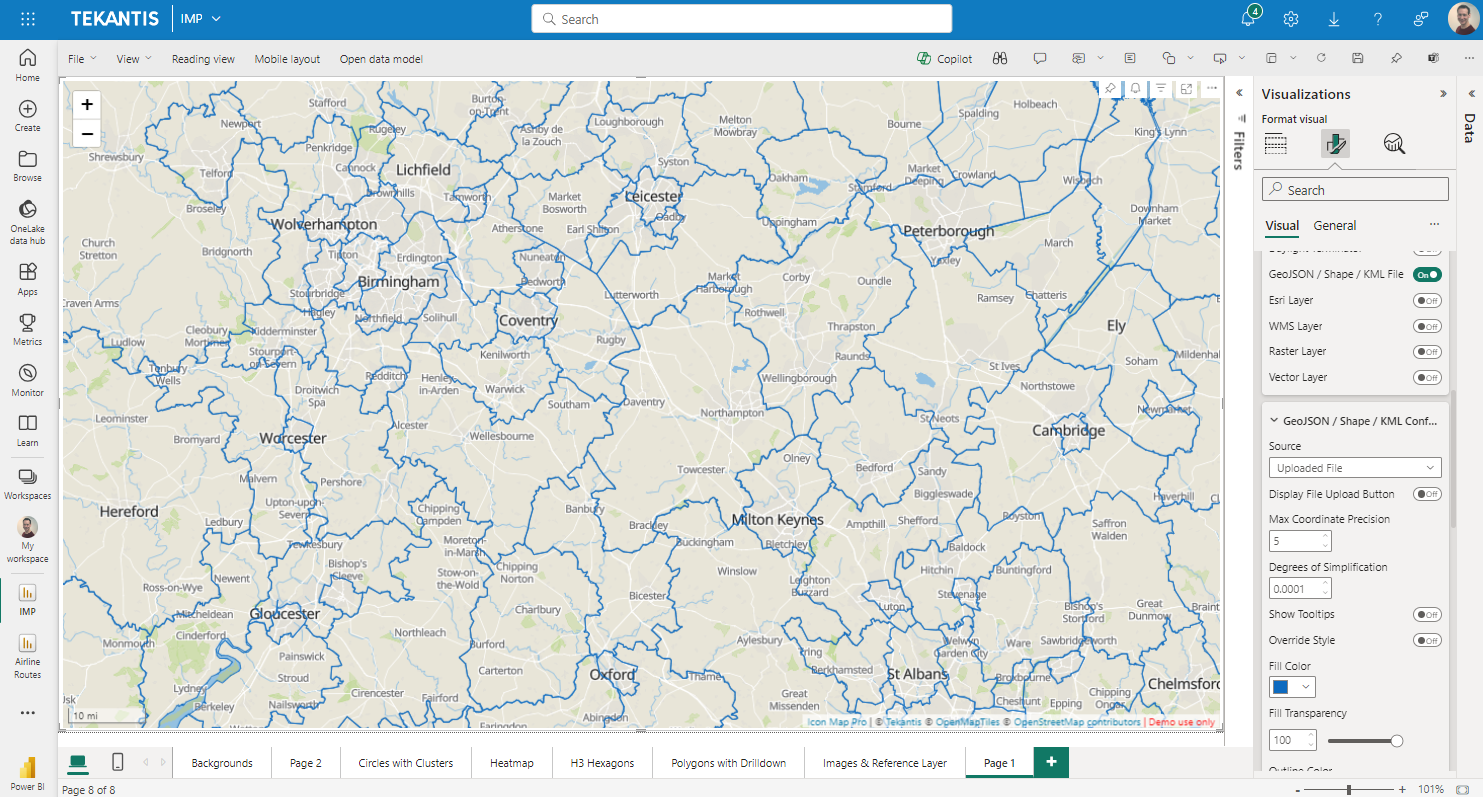
GeoJSON / Shapefile / KML files
It is possible to overlay a static layer on the map made up of points, lines and polygons. The following formats are supported:
KML, GeoJSON and TopoJSON files must have coordinates as longitude and latitudes in EPSG:4326 / WGS84. Esri Shapefiles can be converted automatically within the visual. GeoJSON files are also automatically converted where a CRS attribute exists in the file. If no attribute exists, then Icon Map Pro assumes it is EPSG:4326 / WGS84.
Up to 5 KML/GeoJSON/Shapefile reference layers can either be referenced as external URLs, or uploaded into the Power BI report. All layers must use the same method.
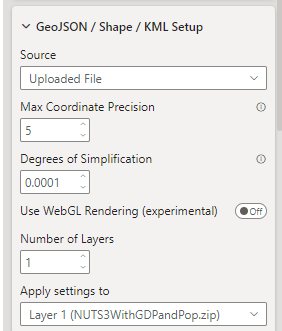
Configure the GeoJSON / Shape / KML reference layers in the setup section, to select which method you will use.
Uploaded files
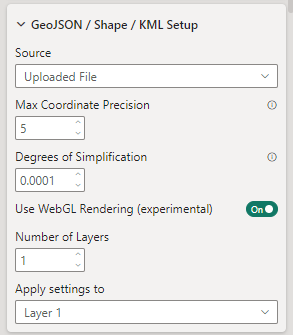
Select "Uploaded File" in the source dropdown.
As the Power BI visuals SDK does not provide the option for a file upload button within the Power BI formatting options, a slightly creative approach has been taken:
- Click the "Display file upload button" toggle switch in the Configuration settings. It will immediately turn off again.

- Either drag your file to the upload area, or click the dark blue upload button - a dialog box should now appear allowing you to select your file.
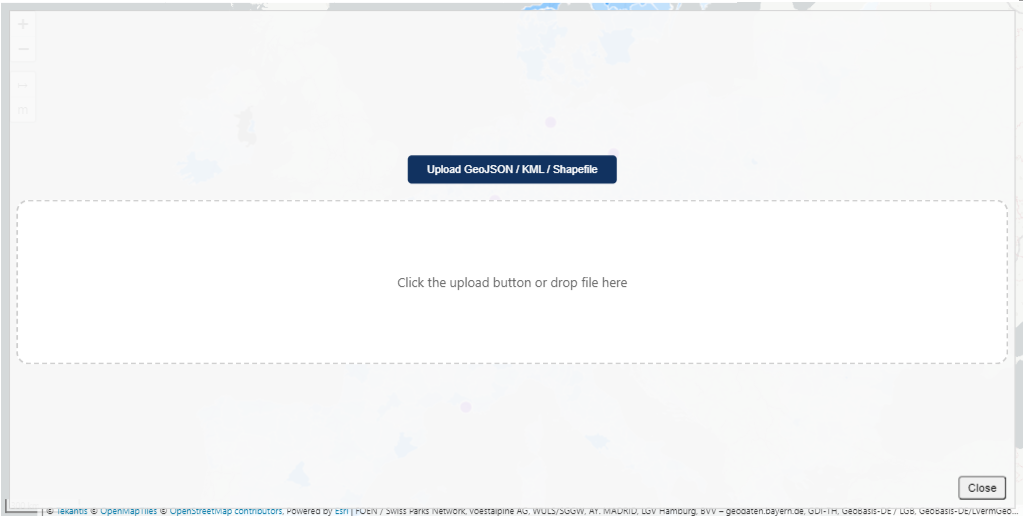
- A status popup will show your file being imported.
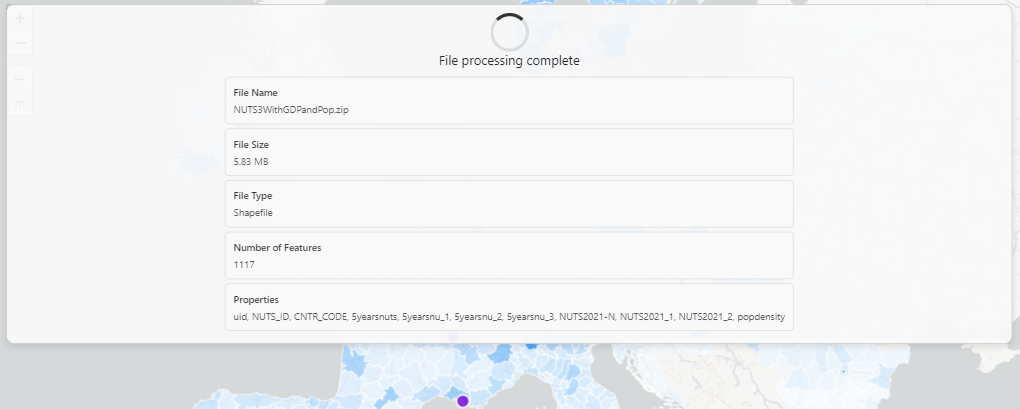
It is important to consider the size of the file you are uploading as it will be stored as part of your .pbix Power BI report file. In addition a large, complex file may slow down performance of the map.
Icon Map Pro performs some initial processing on the uploaded files. Firstly for Esri Shapefiles, these are converted to EPSG:4326 coordinates. Then for all formats, the number of points representing linestrings and polygons are reduced, and the decimal precision of each coordinate are reduced, if necessary. This is configurable within the configuration settings. If you change these values, you will need to upload your file again for the changes to take effect.

The simplification applies the Ramer–Douglas–Peucker algorithm. The degrees of simplification is the number of degrees of tolerance. Each 1 degree equates roughly to 69 miles. For example 0.001 is roughly the size of a US city block.
The coordinate precision specifies the number of decimal places used to store each coordinate.
External URL
It is also possible to reference an external GeoJSON or KML file. The file will be downloaded each time the report page is shown. Select "URL" as the source and enter the URL below. The URL can also be specified as a Power BI measure value. The file must be served from an https address, and the server must be configured to have CORS enabled.
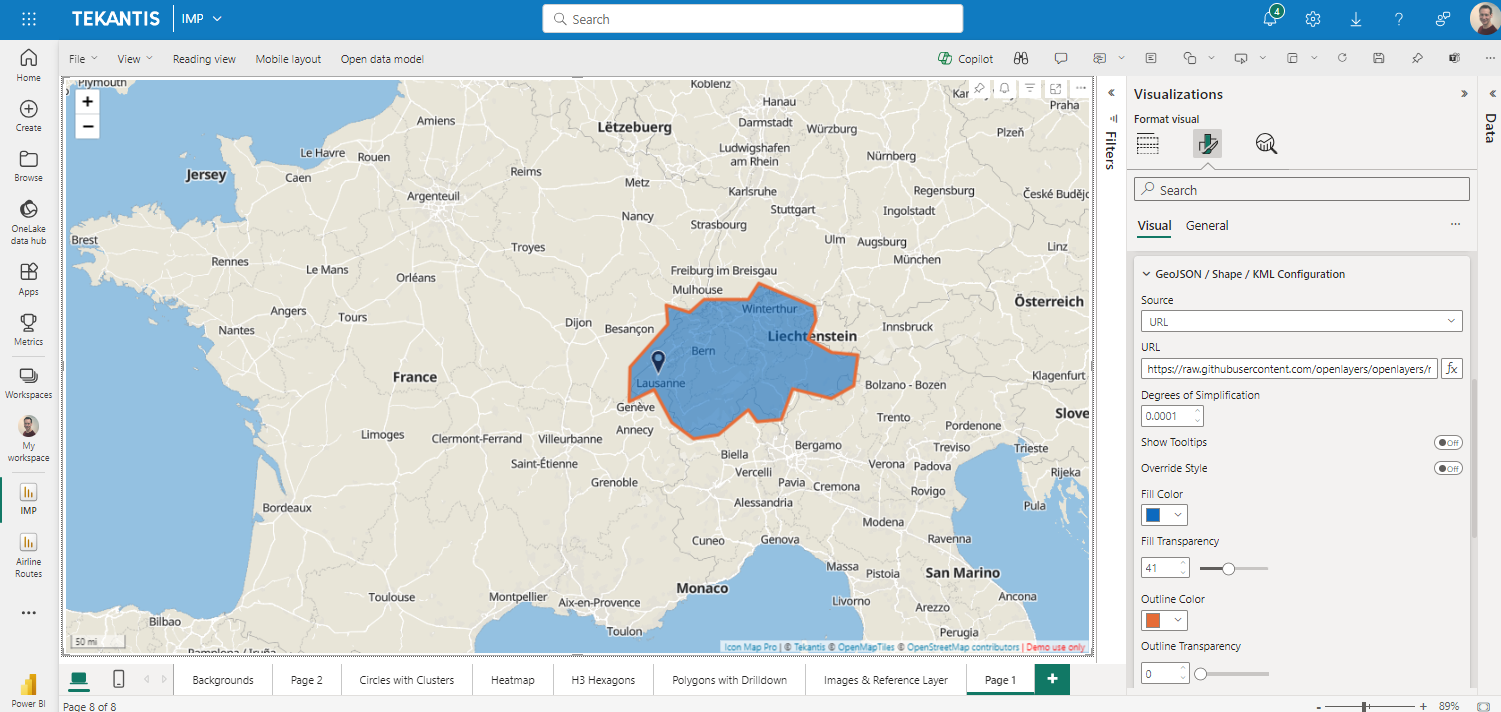
Again the Ramer–Douglas–Peucker algorithm is applied to the file. The degrees of simplification is the number of degrees of tolerance. Each 1 degree equates roughly to 69 miles. For example 0.001 is roughly the size of a US city block.
Multiple Levels
It is possible to add multiple GeoJSON file / Shapefile / KML file reference layers to the same map.
Specify how many layers by setting the "Number of Layers option".
Then use the "Apply settings to" to select a layer. The configuration and formatting options below will then apply to that level. The configuration and formatting options for each layer are set independently, although all layers must use the same source type and simplification settings.
WebGL Rendering (experimental)
![]()
This setting changes the way that GeoJSON / Shapefile / KML objects are drawn on the map. This setting should increase the speed at which large numbers of items or complex items are drawn on the map - especially when zooming and panning around the map. The formatting of reference labels is no longer possible with this item enabled. Reference labels are still supported, but will appear as text without a box on the map. A greater number of reference labels can be supported with the WebGL setting enabled.
Configuration options
Tooltips
Whilst the reference layer won't be linked to the Power BI dataset, it may contain properties that you wish to expose on the map. Enabling the "show tooltips" option will expose any properties against each shape as Power BI tooltips.

Property to Filter
It is possible to filter the features from your file so that only those matching a filter value are displayed on the map.

Select the Property to Filter value from the dropdown. This dropdown should contain a list of properties associated with the features in your file. If using an external URL, you will need to enter this value manually in the textbox.
Then enter the Filter Value to match against. It is possible to set this value using conditional formatting, so it can be based on the context of your data, or a Power BI slicer.
Show Labels
Enables Reference Labels for this layer - the ability to expose one of the feature properties as a text label on the map.
Label Property Name
The name of the property within the Shapefile / GeoJSON file / KML file to be exposed. Configuring this option additionally displays the Reference Label configuration options.
Visible
Whether the layer should be shown or not. This can be set using conditional formatting ('yes' or 'no') to dynamically display a layer according to your data context or a Power BI slicer.
Minimum Zoom
The zoom level at which the layer starts to be shown.
Maximum Zoom
The level at which the layer stops being shown.
Z-Index
A number representing the order of the layer relative to other Icon Map Pro layers.
Formatting Options
Show Points As
This option determines how point data appears on the map.
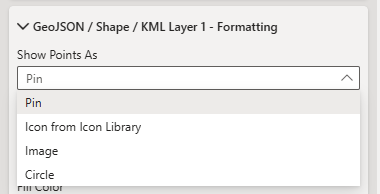
There are 4 options to choose from:
- Pin - Shows a teardrop style map pin.
- Icon From Icon Library - Select from a range of built-in icons.
- Image - Provide the URL for a custom image.
- Circle - Draw circles representing the points.
Override Style
Some files may contain formatting as part of the shape properties. By default these formatting options will be respected and shown on Icon Map Pro. If instead you want to format the shapes using Icon Map Pro, then turn on the "Override Style" toggle.
Fill Color
(From version 1.5.4)
The fill color is configurable in a number of methods:

Static
Specify a specific color for all features in the layer
2 Color or 3 Color Gradient
The color will be based on a numerical value in the property selected:

This property can be selected using conditional formatting to allow a Power BI slicer to be used to select which property values to check against. This allows you to create a choropleth background layer, where the type of information being shown is selected by the user.
Select the colors to form the gradient:

Icon Map Pro will examine all features (taking into account any filter) and determine the minimum, middle and maximum values to determine the gradient. This can be overridden to allow you to enter a specific value. It can also be set using conditional formatting, incase different properties require different ranges.

For any shapes that do not have the selected property, the default color will be used:

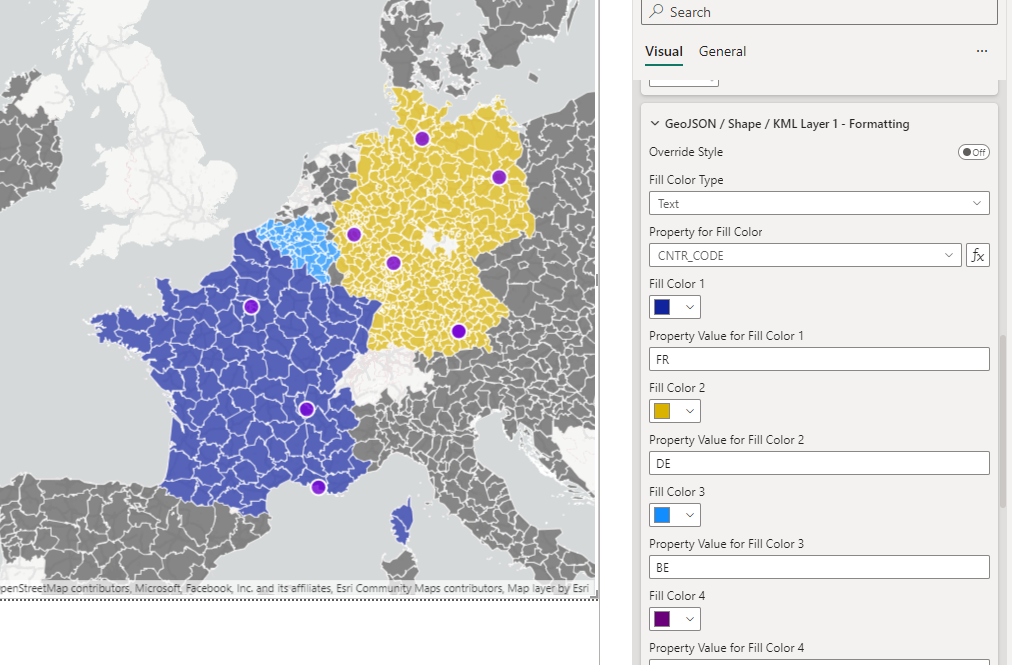
Text
This allows you to specify up to 5 different colors based on the values in your properties. Eg in this example the features in the file have a property named "CNTR_CODE". If the value of CNTR_CODE is "DE" then the fill color will be yellow, etc.
Fill Transparency
A value between 0 and 100 representing the transparency percentage of the fill.
Outline Color Type
This setting allows the shape outlines, or lines to be colored using similar options as the fill color.
Outline Color
The color for polygon outlines and linestrings.
Outline transparency
A value between 0 and 100 representing the transparency percentage of the outline.
Outline width
The number of pixels for the width of the outlines. Decimal numbers can be used for finer detail.
Outline dash array
The dash array determines the pattern used for the line. It consists of a series of space separated numbers. Each value represents the length along the line that should be painted (the dash) and then not painted (the gap). Eg:
4 4