Layers
The map in Icon Map Pro is split up into different layers. These layers represent different types of information, visualization types or technologies. The order in which many of the layers appear can be specified using the z-order setting for that layer.
Background Layer
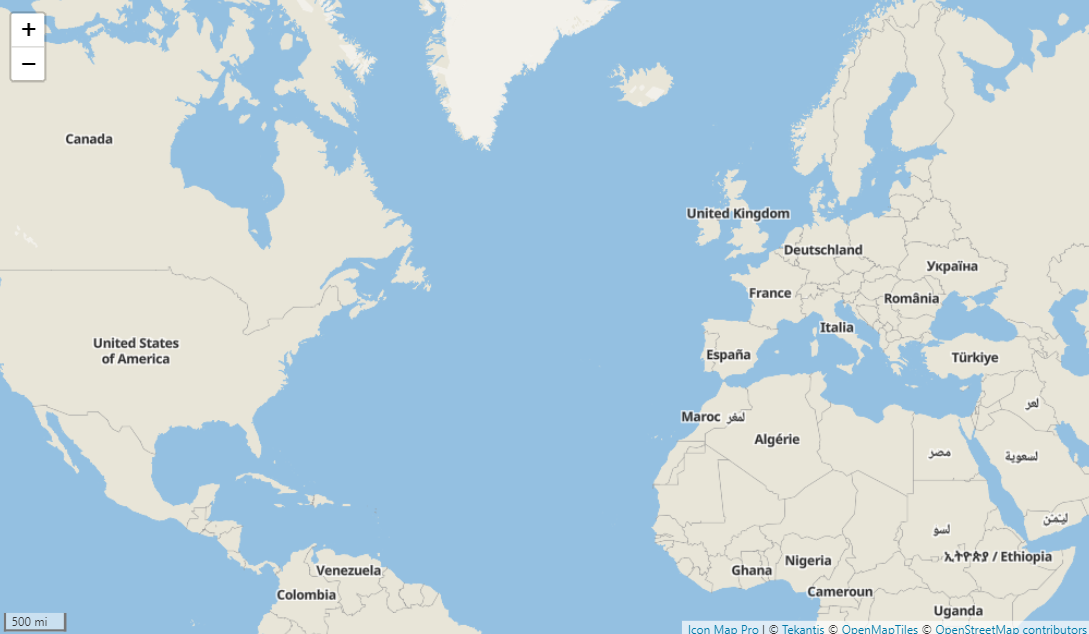
The background map layer is the lowest layer on top of which everything else is presented. It represents the Earth and usually shows country outlines, places, transportation etc.

Icon Map Pro includes its own background maps, included with the license fee, but it's also possible to use those from a number of other providers. Check out the backgrounds documentation for full details.
Overlays and Reference Layers
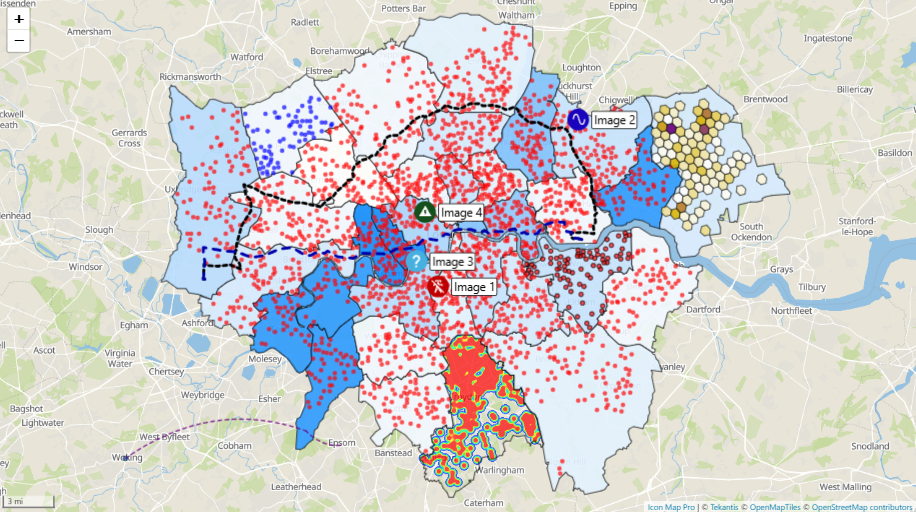
The idea of the reference layers, is that they provide additional context to the map and are usually placed over the background layer. They are non-interactive and not bound to the data in your Power BI dataset - meaning your can't click on them. It is possible however to filter some overlays based on your Power BI data.
There are a number of types of overlay supported by Icon Map Pro allowing you to overlay your own geospatial data, or that of third-parties such as traffic or weather.
More information can be found in the Overlays and Reference Layers section of the documentation.
Data Layers
These are the layers that are bound to your Power BI data. The items displayed on the map are either directly sourced from your dataset, such as longitude and latitude coordinates to draw circles, or linked to your data using a reference field. These items are interactive - they can be clicked on to cross-filter other visuals on your report, or can be cross-filtered by other visuals. They are also formattable based on your Power BI data, for example the size of a circle, or the color of a polygon.

There are many different types of data layer available in Icon Map Pro. It is possible to combine more than one type of data layer at a time.
Data Labels
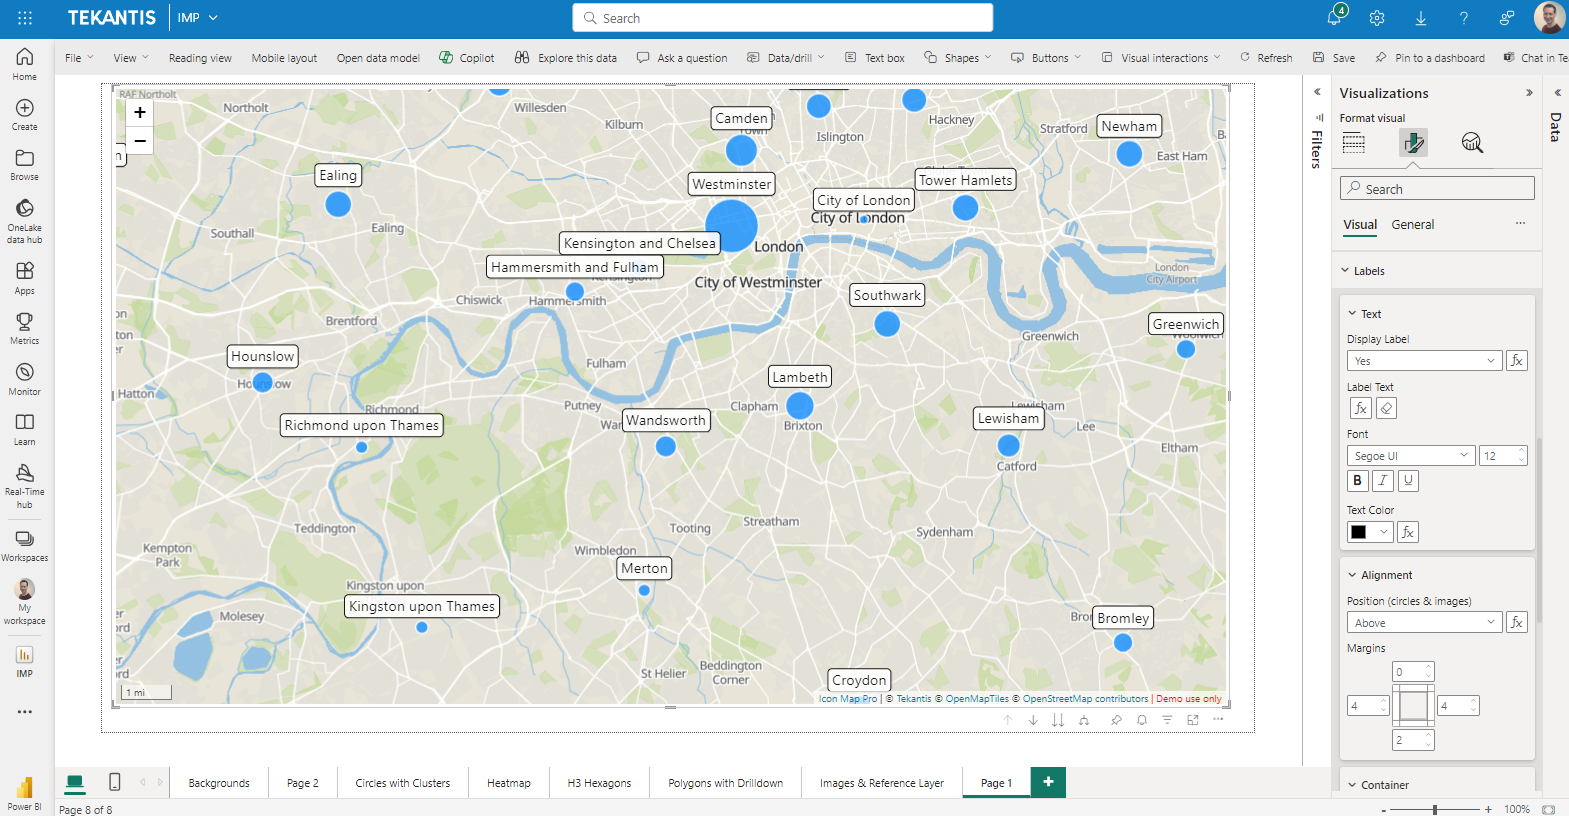
Many of the data layers, allow associated data labels to be added to the map to add additional context.

Controls
Controls are user interface elements that allow how people interact with the map. These include by default + and - buttons to zoom in and out, but there are also options to add additional scales, show the zoom level, lock the zoom level, measure distances etc.