Visualising Indoor Spaces from OpenStreetMap in Power BI with Icon Map Pro

When most people think of maps, they picture roads, rivers, and perhaps outlines of buildings. These are the features most visible in everyday map services, and they’re well covered in OpenStreetMap (OSM), a collaborative global project to create a free, editable map of the world. However, beyond the roads and rooftops, OSM contains a lesser-known layer of spatial data, indoor mapping.
In this article, we’ll explore how to unlock and visualise this hidden indoor data using Power Query and Icon Map Pro. We’ll focus on a couple of practical examples: a detailed hospital floor plan, and a shopping mall digital twin.
What is OpenStreetMap?
OpenStreetMap is often described as the “Wikipedia of maps.” Contributors around the world upload and refine geospatial data covering everything from buildings and highways to footpaths and forests. OSM data is open and freely available, making it a valuable foundation for many GIS and analytics applications.
What’s less known is that OSM also supports detailed indoor mapping through a structured tagging scheme. Tags such as indoor=room, level=, room=, and building:part allow contributors to define internal spaces such as hallways, offices, hospital rooms, and more. Some dedicated platforms, such as OpenLevelUp and indoor=, showcase this data, but it’s not typically exposed in standard maps.
Despite this, a surprising number of buildings have detailed internal mapping. Airports, train stations, universities, and hospitals are often rich with this hidden geometry, if you know where to look.
First Example: Hospital Floor Plans in Denver
We set out to see how much detail we could extract from OpenStreetMap for a real-world building. After exploring various cities, we discovered that a hospital in Denver, Colorado has been extensively mapped, with rooms, corridors, toilets, and walls all represented using the OSM indoor tagging model.
Using the Overpass API, we queried for all objects in a bounding box around the hospital that included tags like indoor=room, room=*, and level=*. This gave us a rich dataset of floor plans directly from the open map, structured as OSM way elements with sets of nodes forming closed loops.
The question then became: how do we transform this into something visual and interactive in Power BI?
Accessing OSM Data: Introducing Overpass and Overpass QL
Before diving into Power Query, it's important to understand how we extract data from OpenStreetMap. The Overpass API is a read-only API that allows users to query and extract subsets of OSM data using a powerful query language called Overpass QL. It supports filtering by tags, bounding boxes, and spatial relationships.
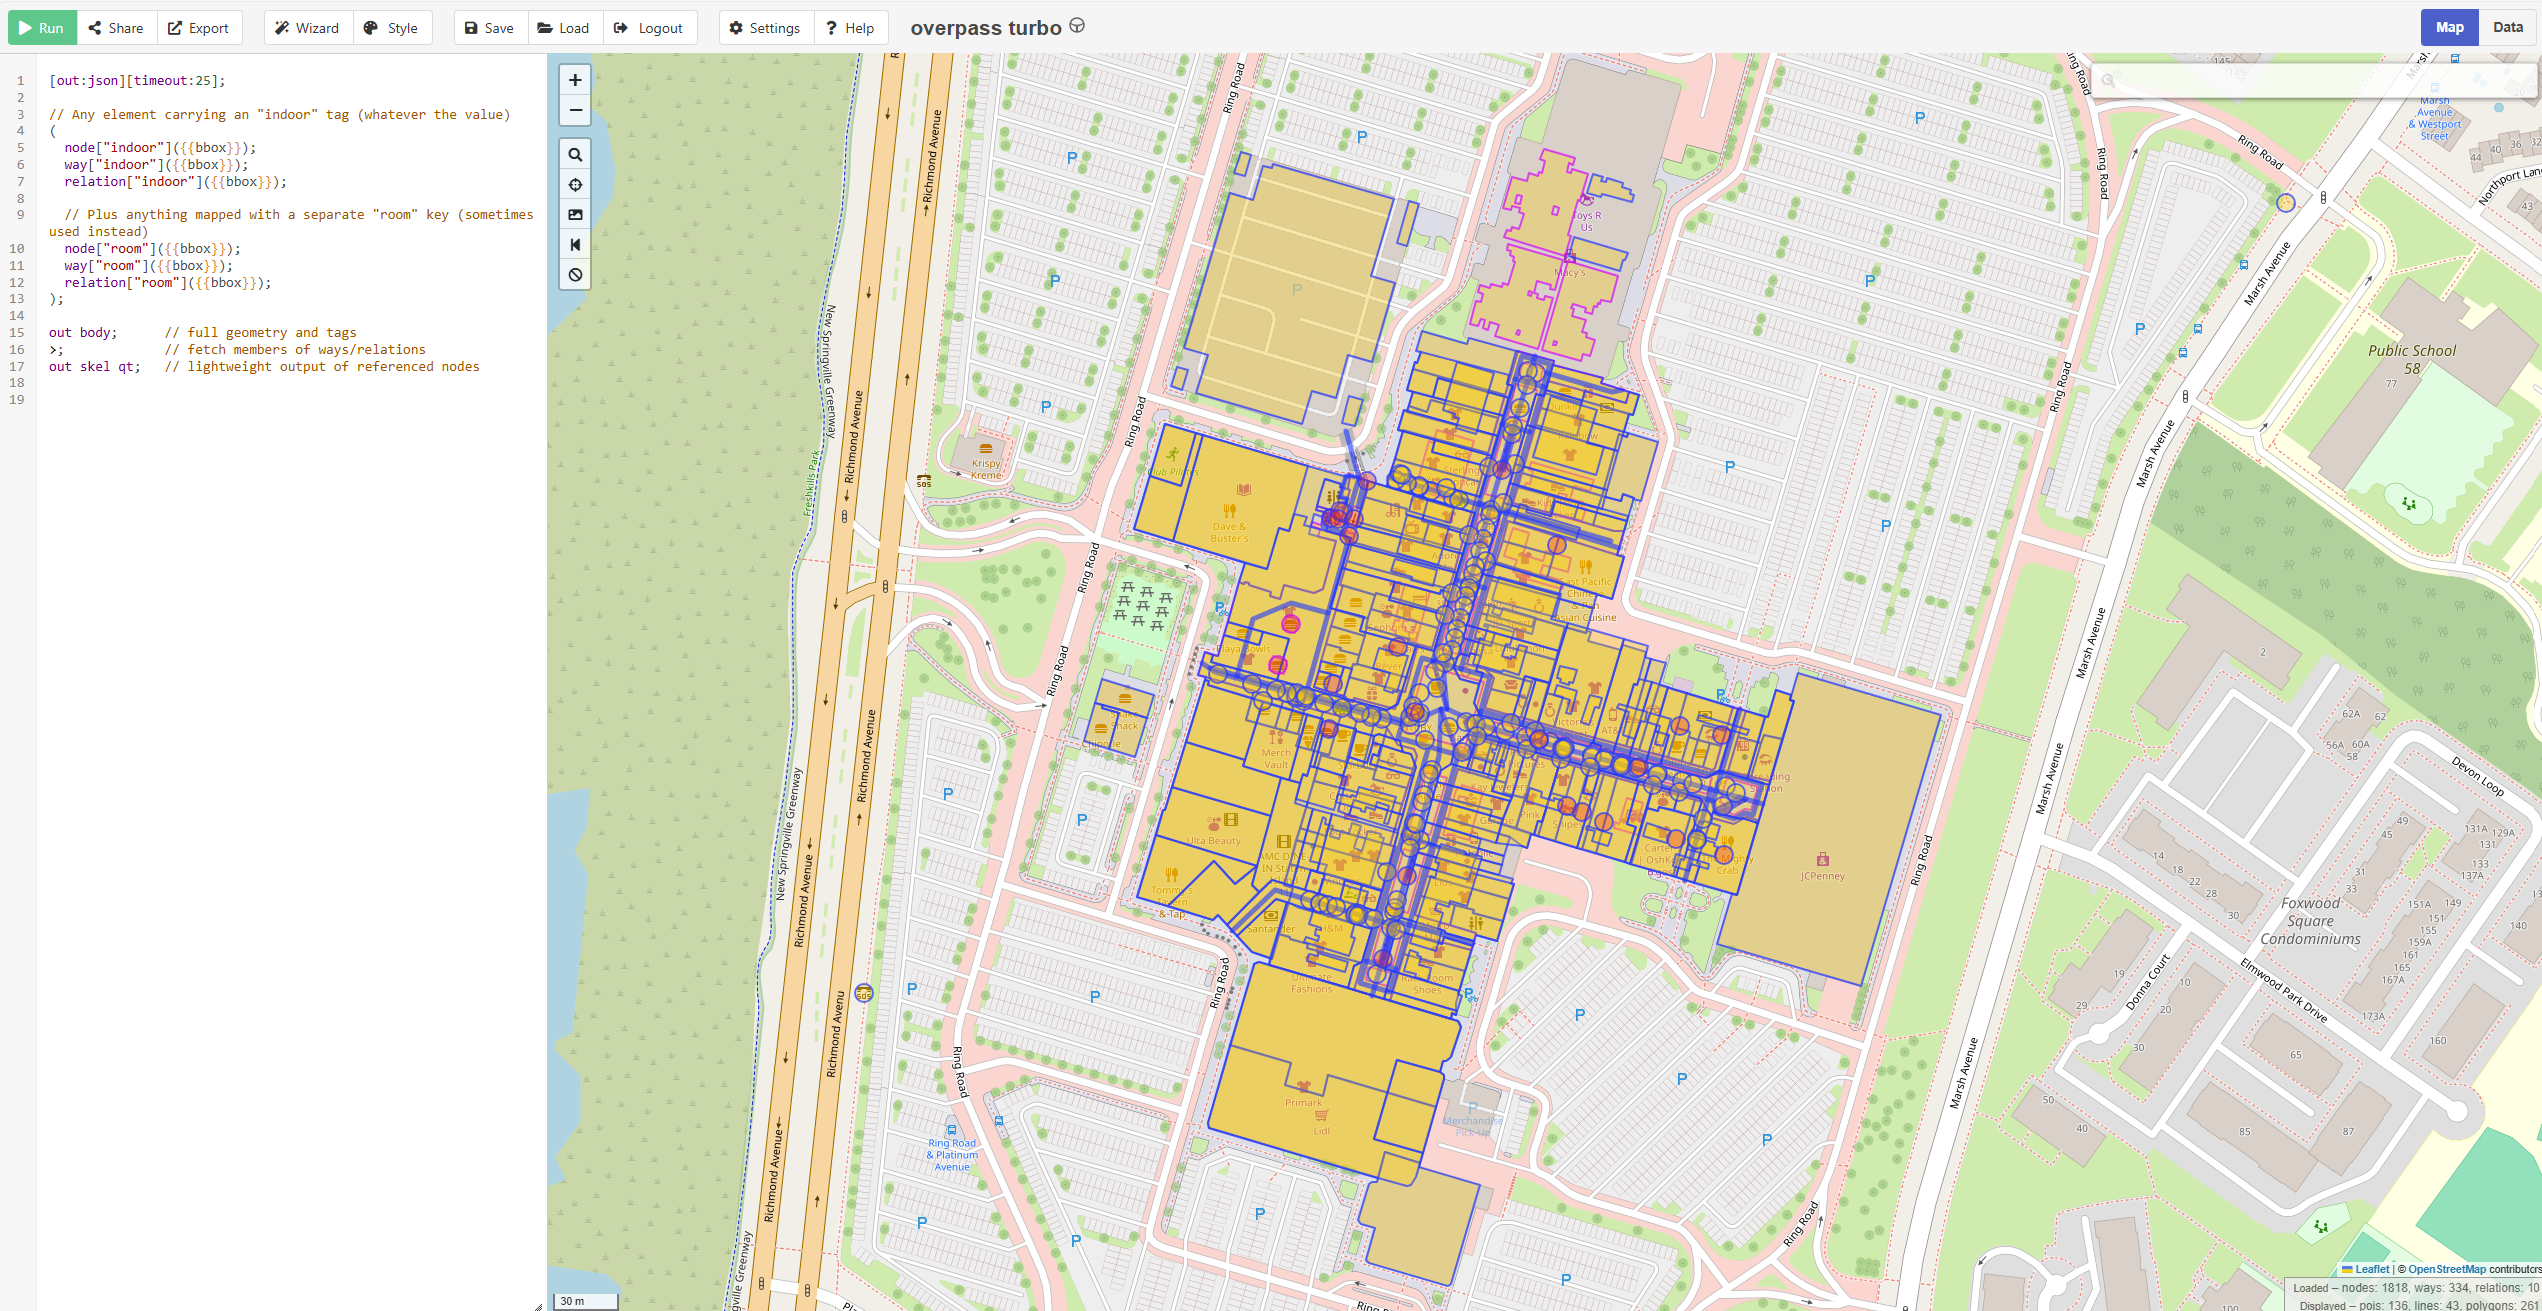
You can explore and test Overpass QL queries using the interactive editor at overpass-turbo.eu.
Here's a sample query that returns indoor-related elements:
[out:json][timeout:25];

// Any element carrying an "indoor" tag (whatever the value)
(
  node["indoor"]({{bbox}});
  way["indoor"]({{bbox}});
  relation["indoor"]({{bbox}});

  // Plus anything mapped with a separate "room" key (sometimes used instead)
  node["room"]({{bbox}});
  way["room"]({{bbox}});
  relation["room"]({{bbox}});
);

out body geom;      // full geometry and tags
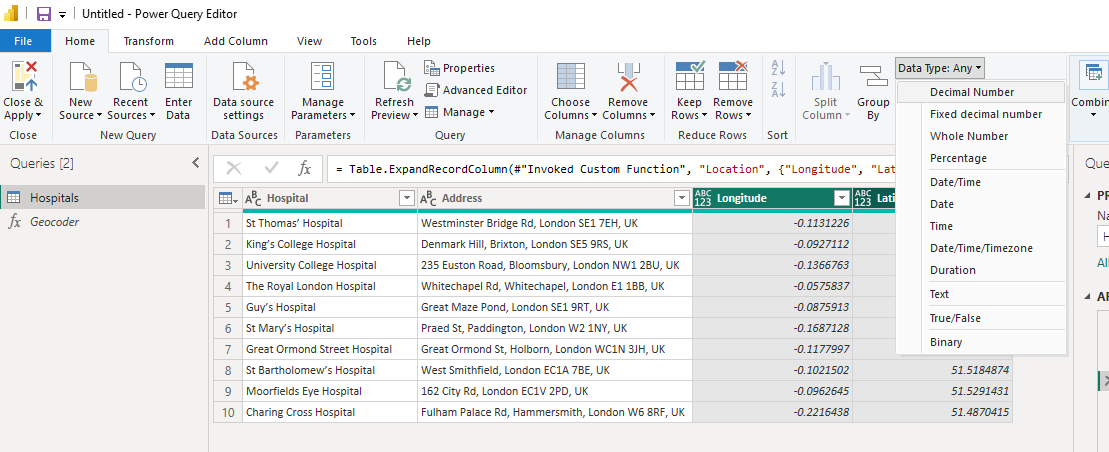
Extracting and Converting the Geometry in Power Query
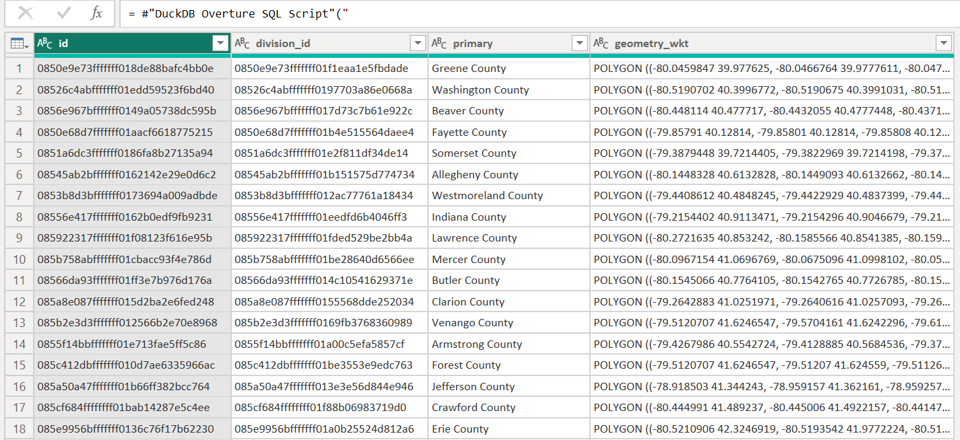
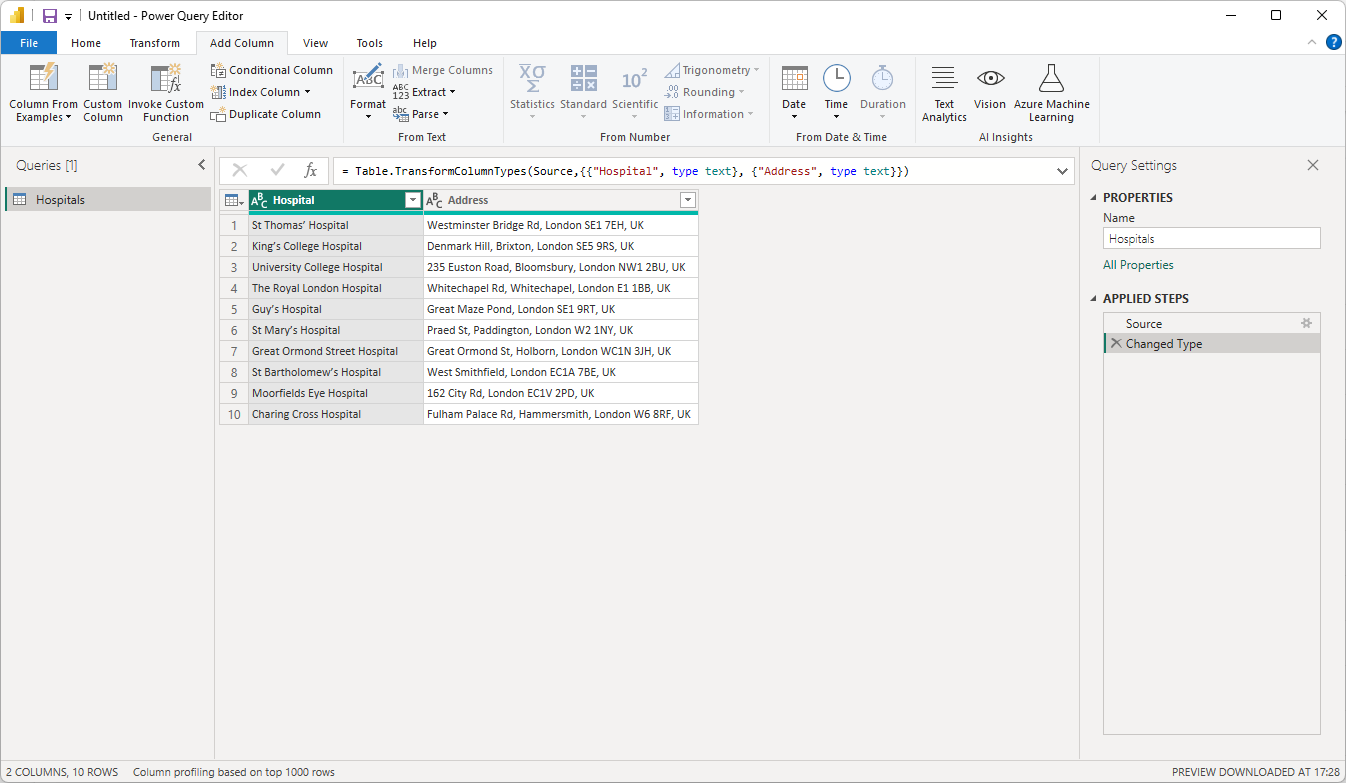
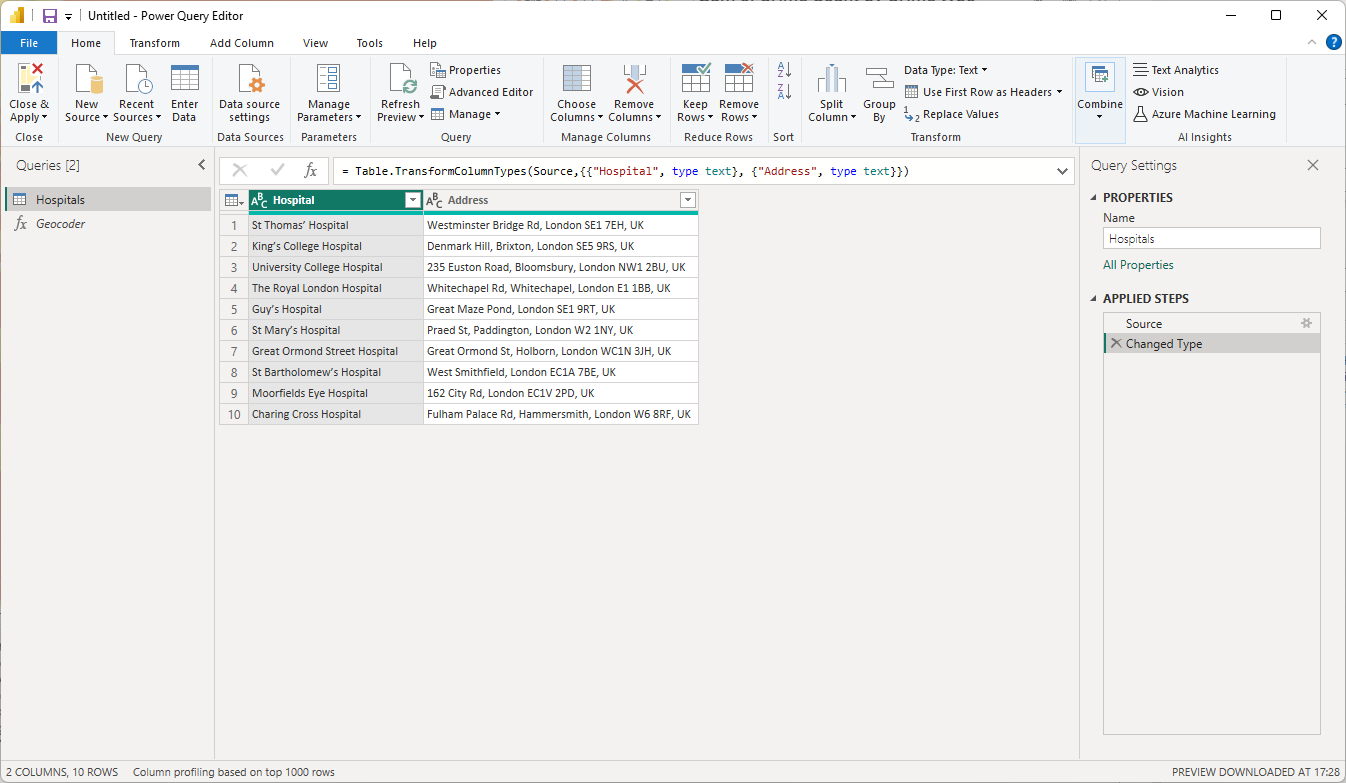
To load the data into Power BI, we created a Power Query function that sends the Overpass QL query to the API, receives the JSON response, and parses the elements into a table. We handle the processing of OSM geometry data by parsing it into WKT (Well-Known Text) format, which is natively supported by Icon Map Pro for rendering vector shapes in Power BI.
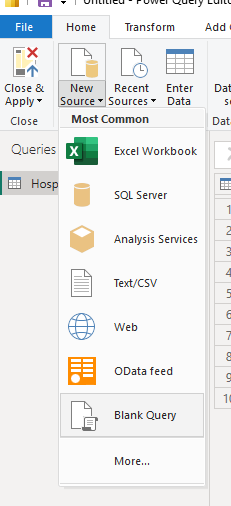
Here is an example Power Query snippet that call our function, there are also some additional cleaning steps we did:
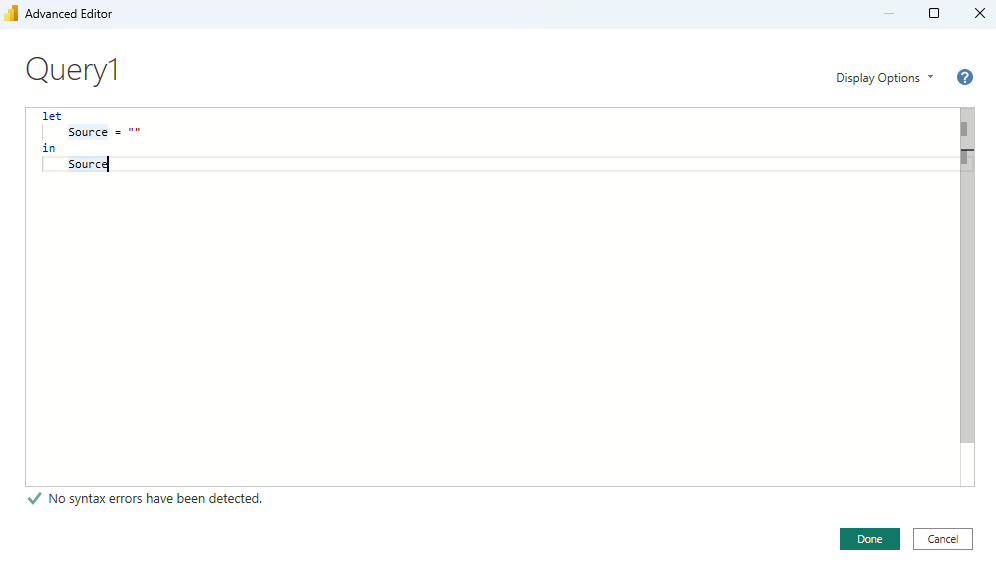
let
    Source = #"OSM Overpass Query"("[out:json][timeout:25];

// Any element carrying an ""indoor"" tag (whatever the value)
(
  node[""indoor""](39.727719308804495,-104.99282167277055,39.729021993404594,-104.99005363306718);
  way[""indoor""](39.727719308804495,-104.99282167277055,39.729021993404594,-104.99005363306718);
  relation[""indoor""](39.727719308804495,-104.99282167277055,39.729021993404594,-104.99005363306718);

  // Plus anything mapped with a separate ""room"" key (sometimes used instead)
  node[""room""](39.727719308804495,-104.99282167277055,39.729021993404594,-104.99005363306718);
  way[""room""](39.727719308804495,-104.99282167277055,39.729021993404594,-104.99005363306718);
  relation[""room""](39.727719308804495,-104.99282167277055,39.729021993404594,-104.99005363306718);
);

out body;      // full geometry and tags
>;             // fetch members of ways/relations
out skel qt;   // lightweight output of referenced nodes", null),
    #"Extracted Values" = Table.TransformColumns(Source, {"nodes", each Text.Combine(List.Transform(_, Text.From), ","), type text}),
    #"Filtered Rows" = Table.SelectRows(#"Extracted Values", each ([WKT] <> null) and ([type] = "way")),
    #"Removed Columns" = Table.RemoveColumns(#"Filtered Rows",{"nodes", "members", "bounds", "lon", "lat"}),
    #"Replaced Value" = Table.ReplaceValue(#"Removed Columns","toilet","toilets",Replacer.ReplaceText,{"tag_amenity"}),
    #"Replaced Value1" = Table.ReplaceValue(#"Replaced Value","toiletss","toilets",Replacer.ReplaceText,{"tag_amenity"}),
    #"Replaced Value2" = Table.ReplaceValue(#"Replaced Value1","bathroom","shower",Replacer.ReplaceText,{"tag_amenity"}),
    #"Replaced Value3" = Table.ReplaceValue(#"Replaced Value2","toilet","toilets",Replacer.ReplaceText,{"tag_room"}),
    #"Filtered Rows1" = Table.SelectRows(#"Replaced Value3", each ([tag_indoor] = "corridor" or [tag_indoor] = "room")),
    #"Replaced Value4" = Table.ReplaceValue(#"Filtered Rows1","toiletss","toilets",Replacer.ReplaceText,{"tag_room"}),
    #"Replaced Value5" = Table.ReplaceValue(#"Replaced Value4","bathroom","shower",Replacer.ReplaceText,{"tag_room"}),
    #"Replaced Value6" = Table.ReplaceValue(#"Replaced Value5","meeting","examination",Replacer.ReplaceText,{"tag_room"}),
    #"Replaced Value7" = Table.ReplaceValue(#"Replaced Value6","workshop","screening",Replacer.ReplaceText,{"tag_room"}),
    #"Replaced Value8" = Table.ReplaceValue(#"Replaced Value7","lobby","reception",Replacer.ReplaceText,{"tag_room"}),
// If tag_room is null AND the corridor flag is present, set it to "corridor"
#"Set tag_room for corridors" =
    let
        Added = Table.AddColumn(
            #"Replaced Value8",
            "tag_room_tmp",
            each if [tag_room] = null
                    and ( [type] = "corridor" or [tag_indoor] = "corridor" )
                 then "corridor"
                 else [tag_room],
            type text
        ),
        RemovedOld = Table.RemoveColumns(Added, {"tag_room"}),
        Renamed    = Table.RenameColumns(RemovedOld, {{"tag_room_tmp", "tag_room"}})
    in
        Renamed,
    #"Removed Columns1" = Table.RemoveColumns(#"Set tag_room for corridors",{"tag_highway", "tag_note", "tag_local_ref", "tag_addr:city", "tag_addr:housenumber", "tag_addr:postcode", "tag_addr:state", "tag_addr:street", "tag_brand", "tag_brand:wikidata", "tag_cuisine", "tag_delivery", "tag_drive_through", "tag_opening_hours", "tag_outdoor_seating", "tag_phone", "tag_smoking", "tag_takeaway", "tag_website", "tag_website:menu", "tag_operator", "tag_shop", "tag_area", "tag_toilets:disposal", "tag_amenity", "tag_level"}),
    #"Reordered Columns" = Table.ReorderColumns(#"Removed Columns1",{"type", "id", "geometry", "tag_access", "tag_room", "tag_indoor", "tag_name", "tag_ref", "tag_unisex", "tag_wheelchair", "tag_female", "tag_male", "WKT"})
in
    #"Reordered Columns"
You may notice that the Overpass query uses {{bbox}}, while in Power Query we specify actual coordinates. {{bbox}} is a special placeholder in Overpass that represents the current visible area in tools like Overpass Turbo. To get the final query with real coordinates, simply click Export and choose Copy raw query.
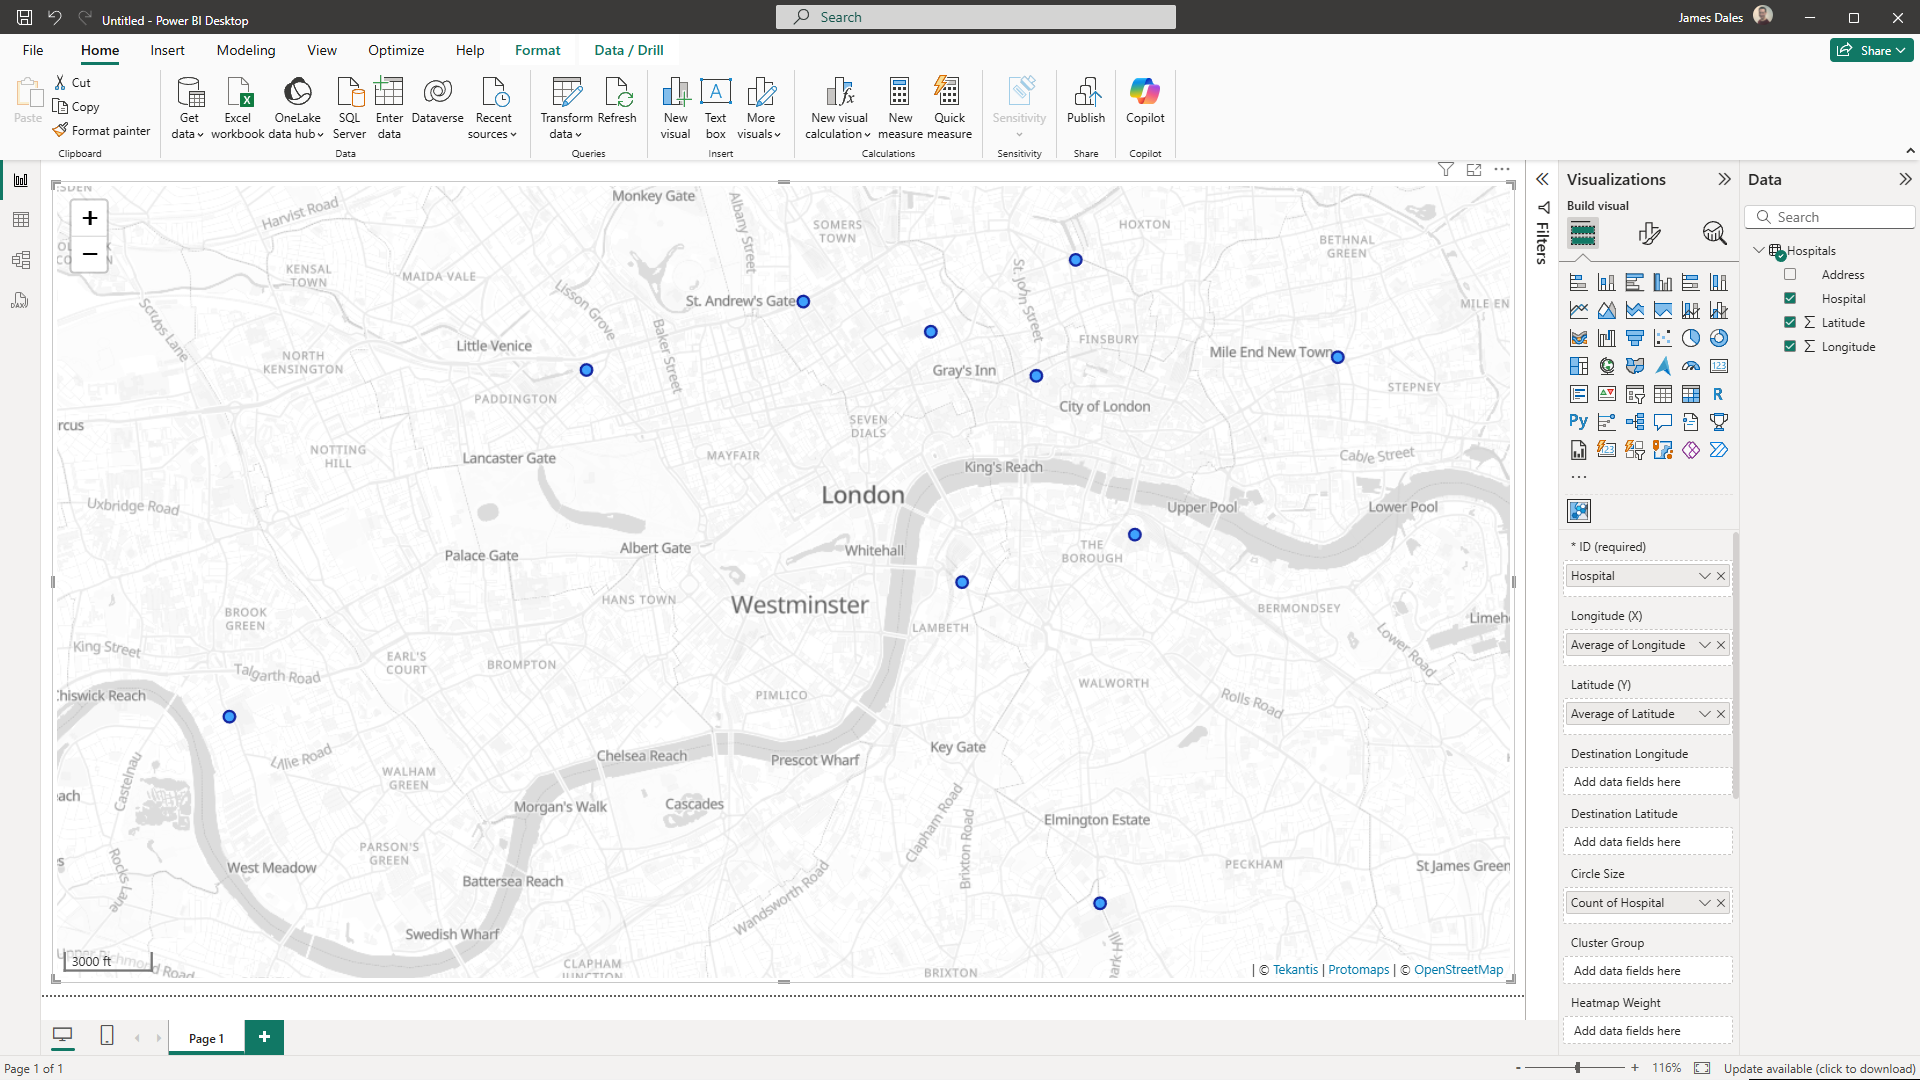
Visualising the Result in Icon Map Pro
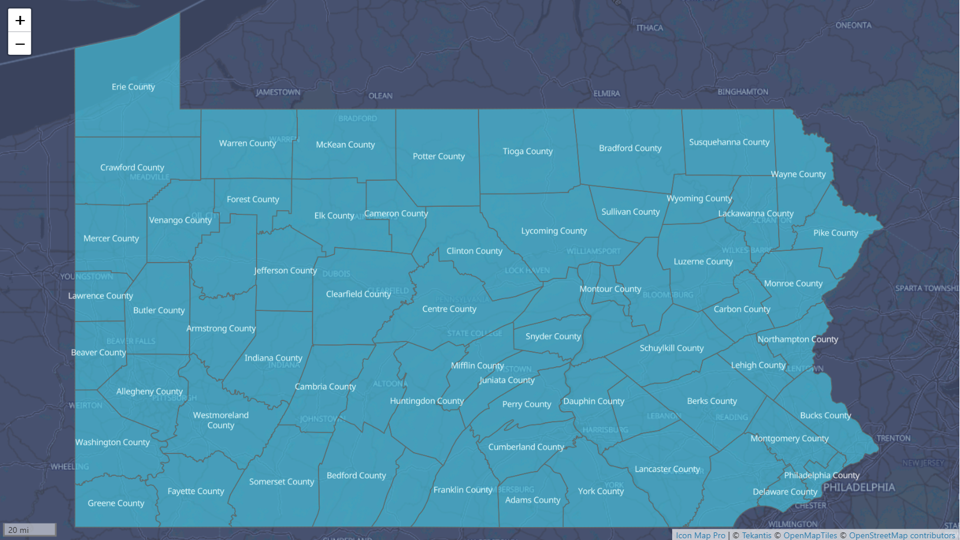
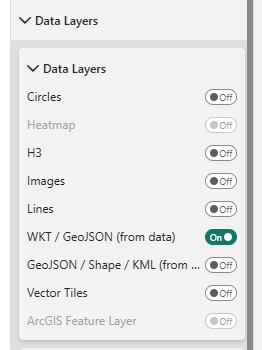
Once the WKT column is ready, it’s a simple matter of dropping it into Icon Map Pro, using the built in support for WKT layers. The result? A full, zoomable, interactive floor plan of the hospital within Power BI.
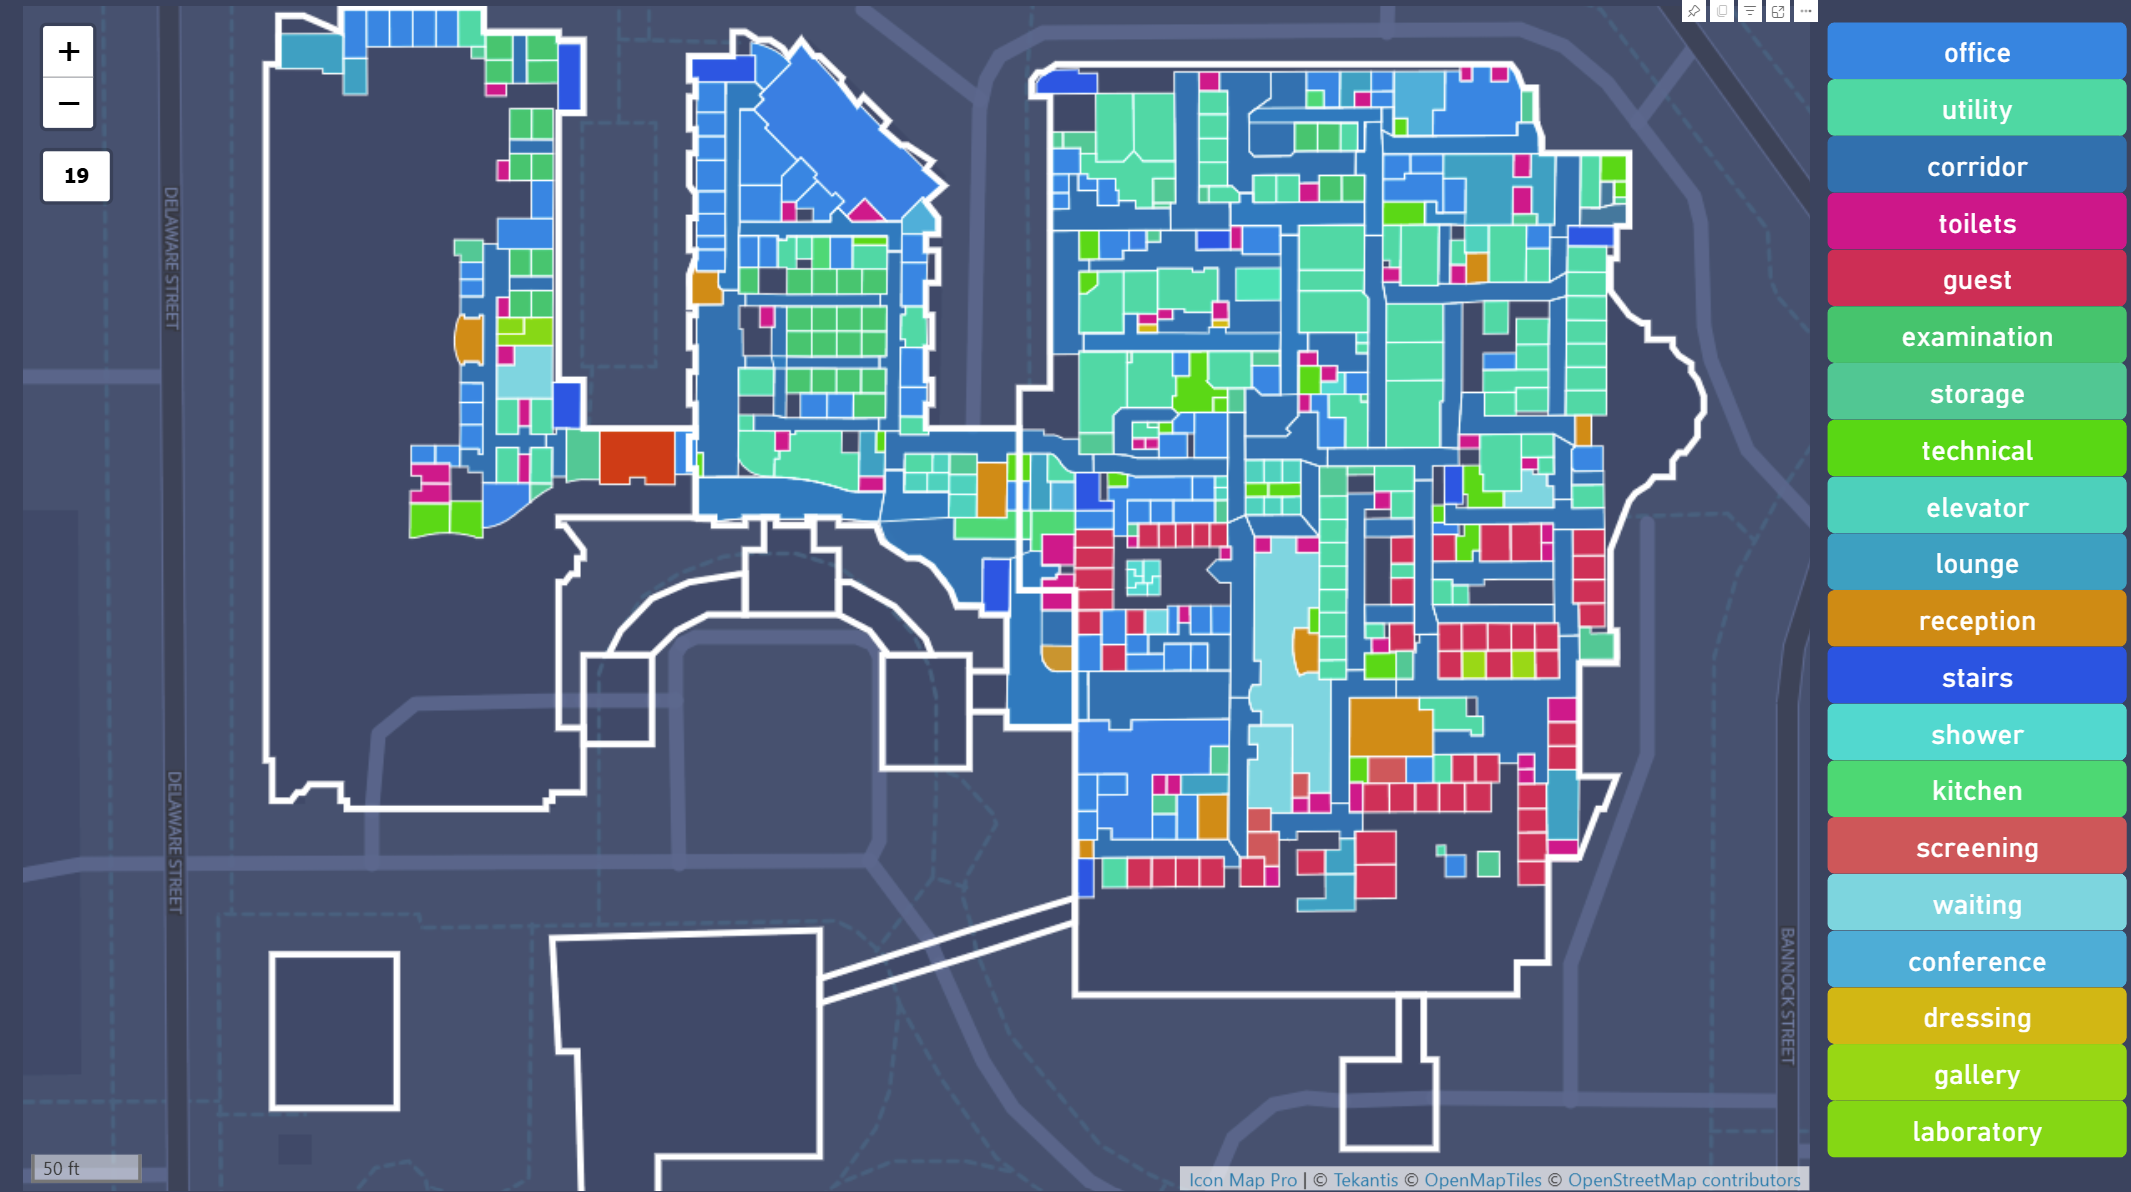
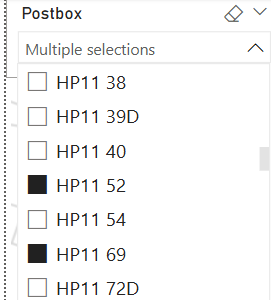
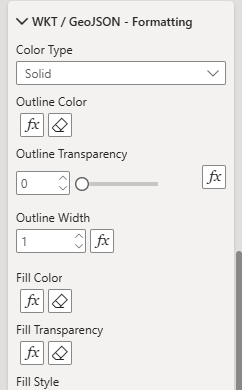
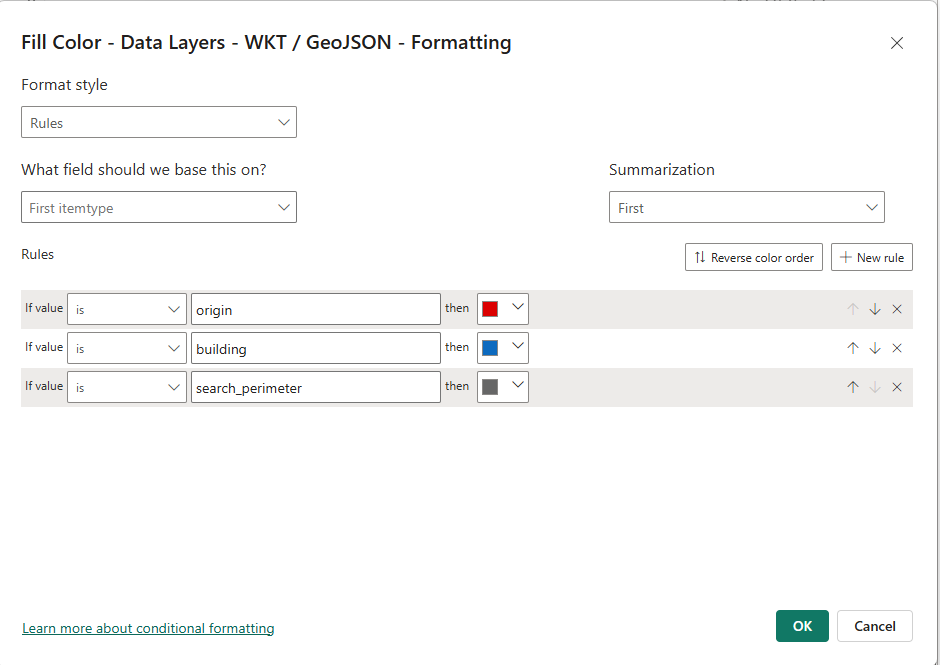
In this example, we are colouring rooms by type, adding basic tooltips with room metadata, and using the new Power Slicer visual as an interactive legend to dynamically filter the floor plan. While this is a simple demonstration, the same approach could be developed into a full digital twin solution for a hospital. For example, it could overlay sensor data such as room occupancy or air quality, integrate cleaning or maintenance schedules, highlight emergency routes, or track patient movements and staff locations in real time, the possibilities are endless.
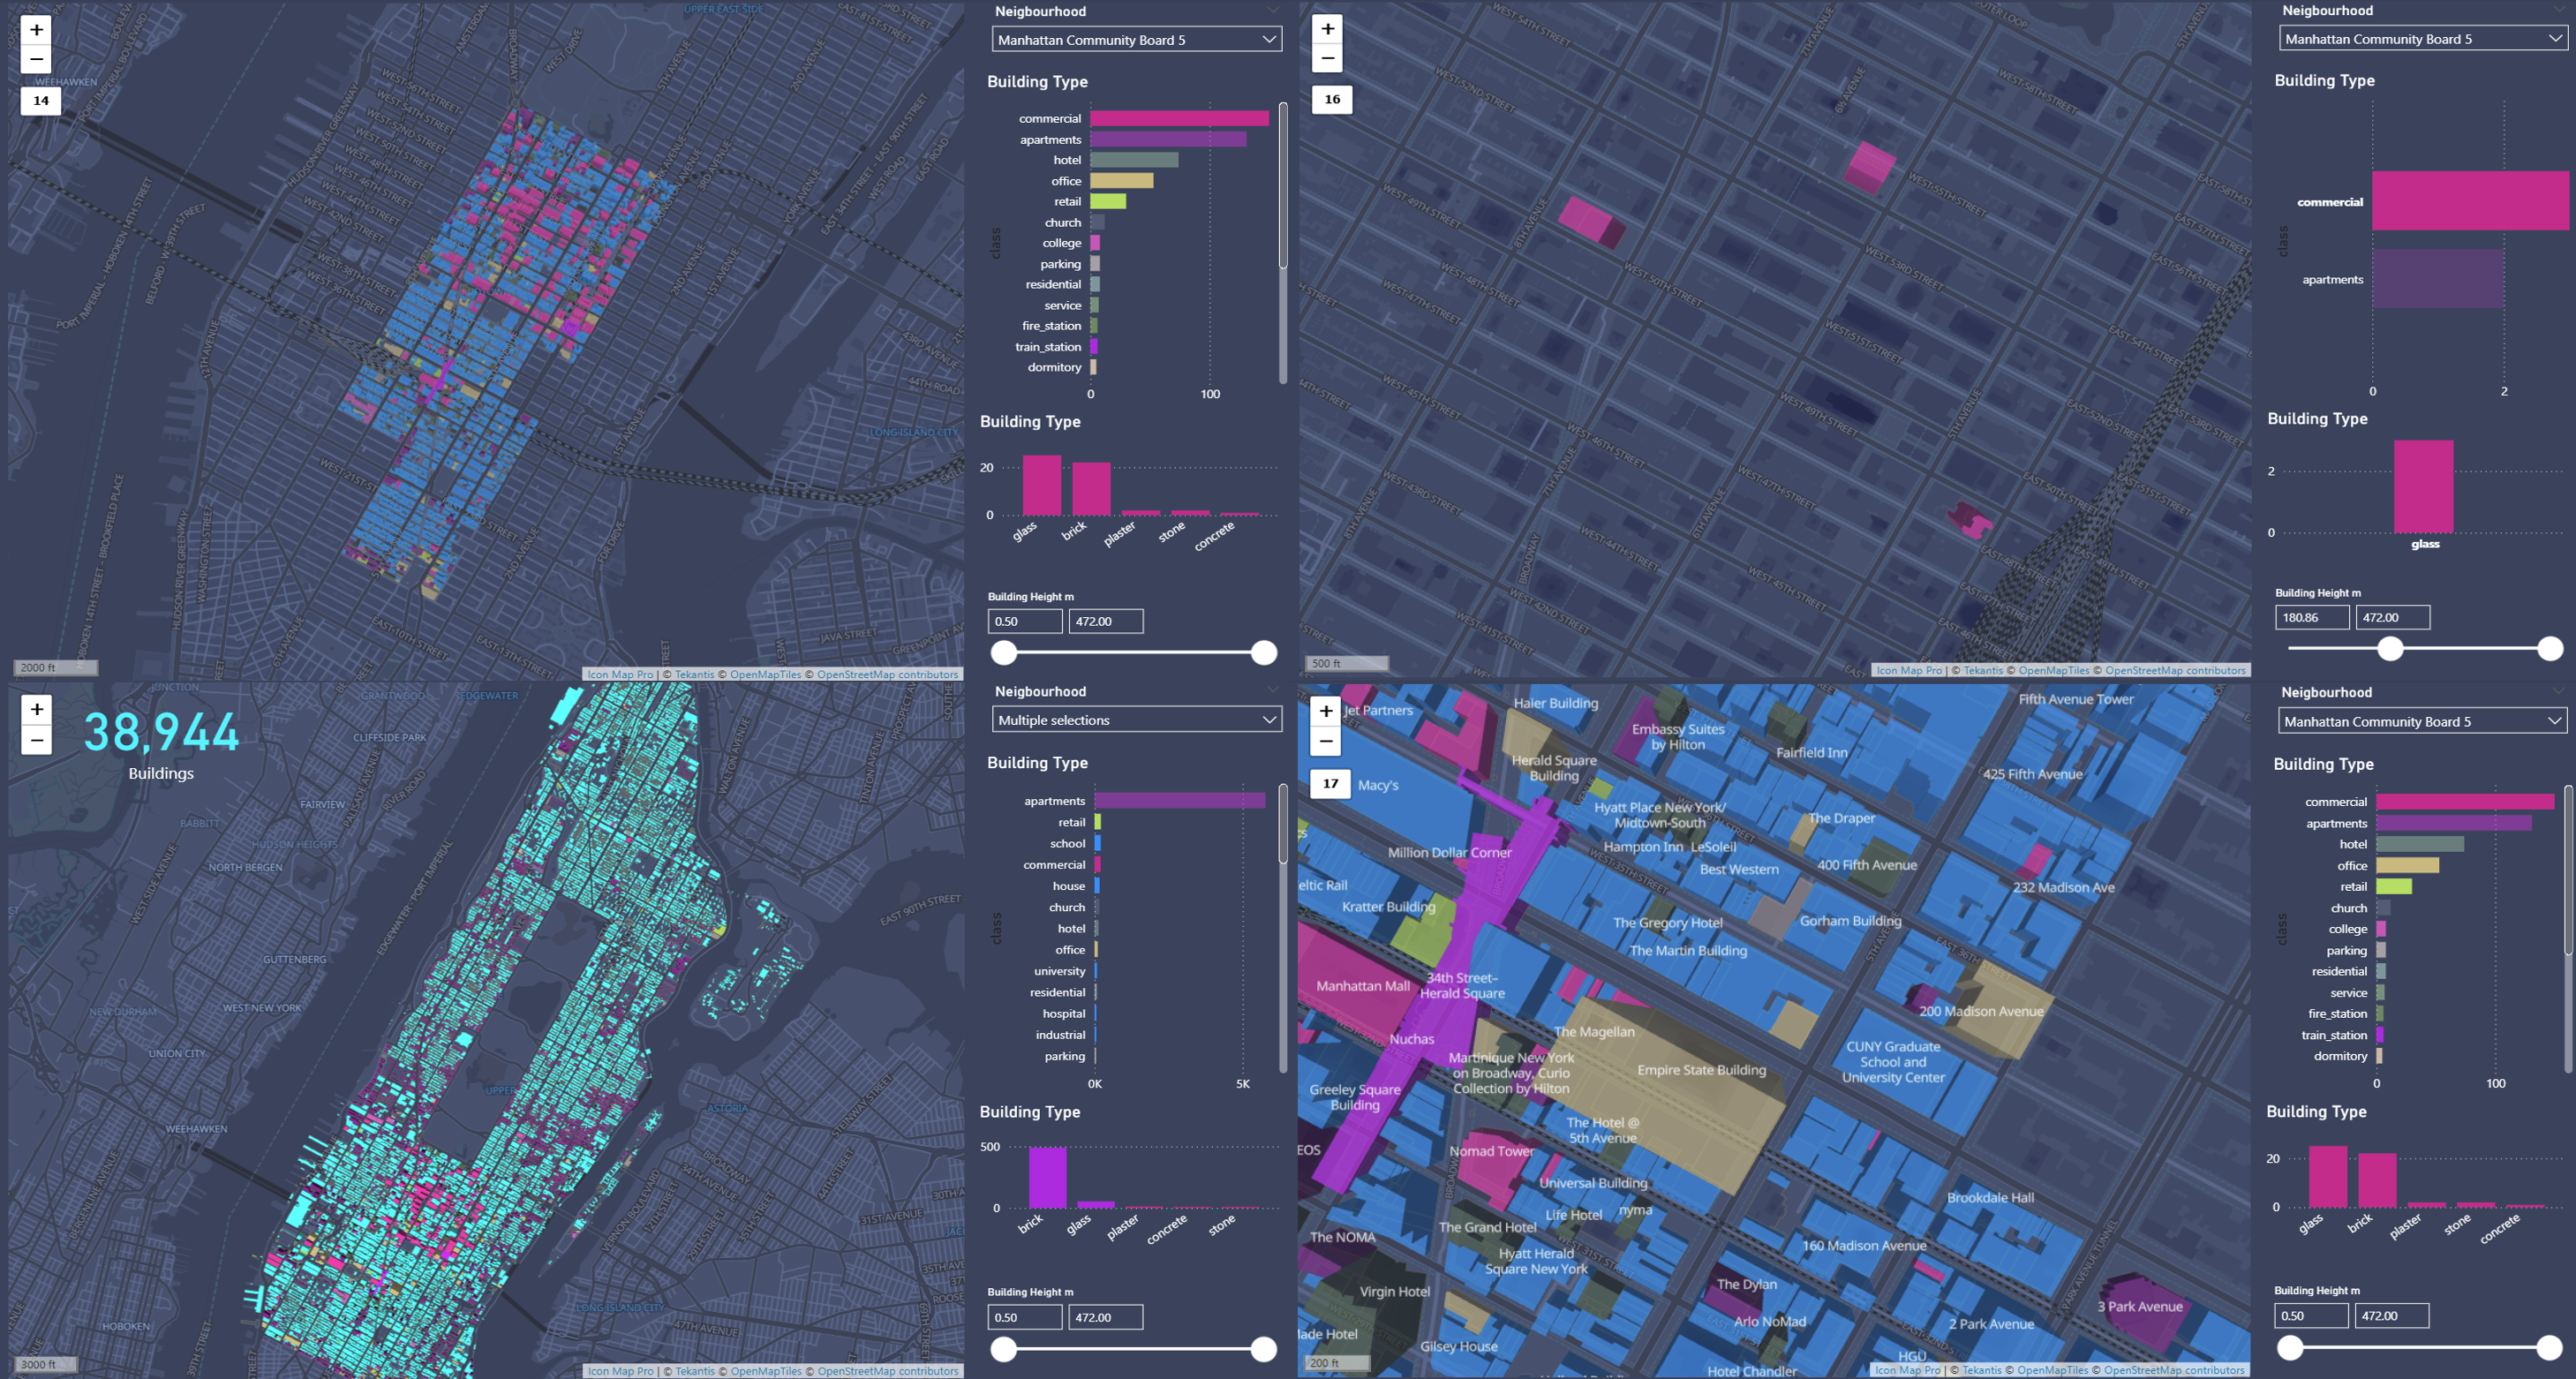
Example 2 – Shopping Mall
The hospital example worked well, but we also came across some highly detailed indoor maps of shopping malls. These were particularly interesting due to their multiple floors and extensive tagging. By repeating the same Overpass query pattern and incorporating a simple level slicer in Power BI, we were able to build a visual representation of a multi-storey shopping centre. In our demo, shops were displayed with vacant units clearly highlighted in pink.
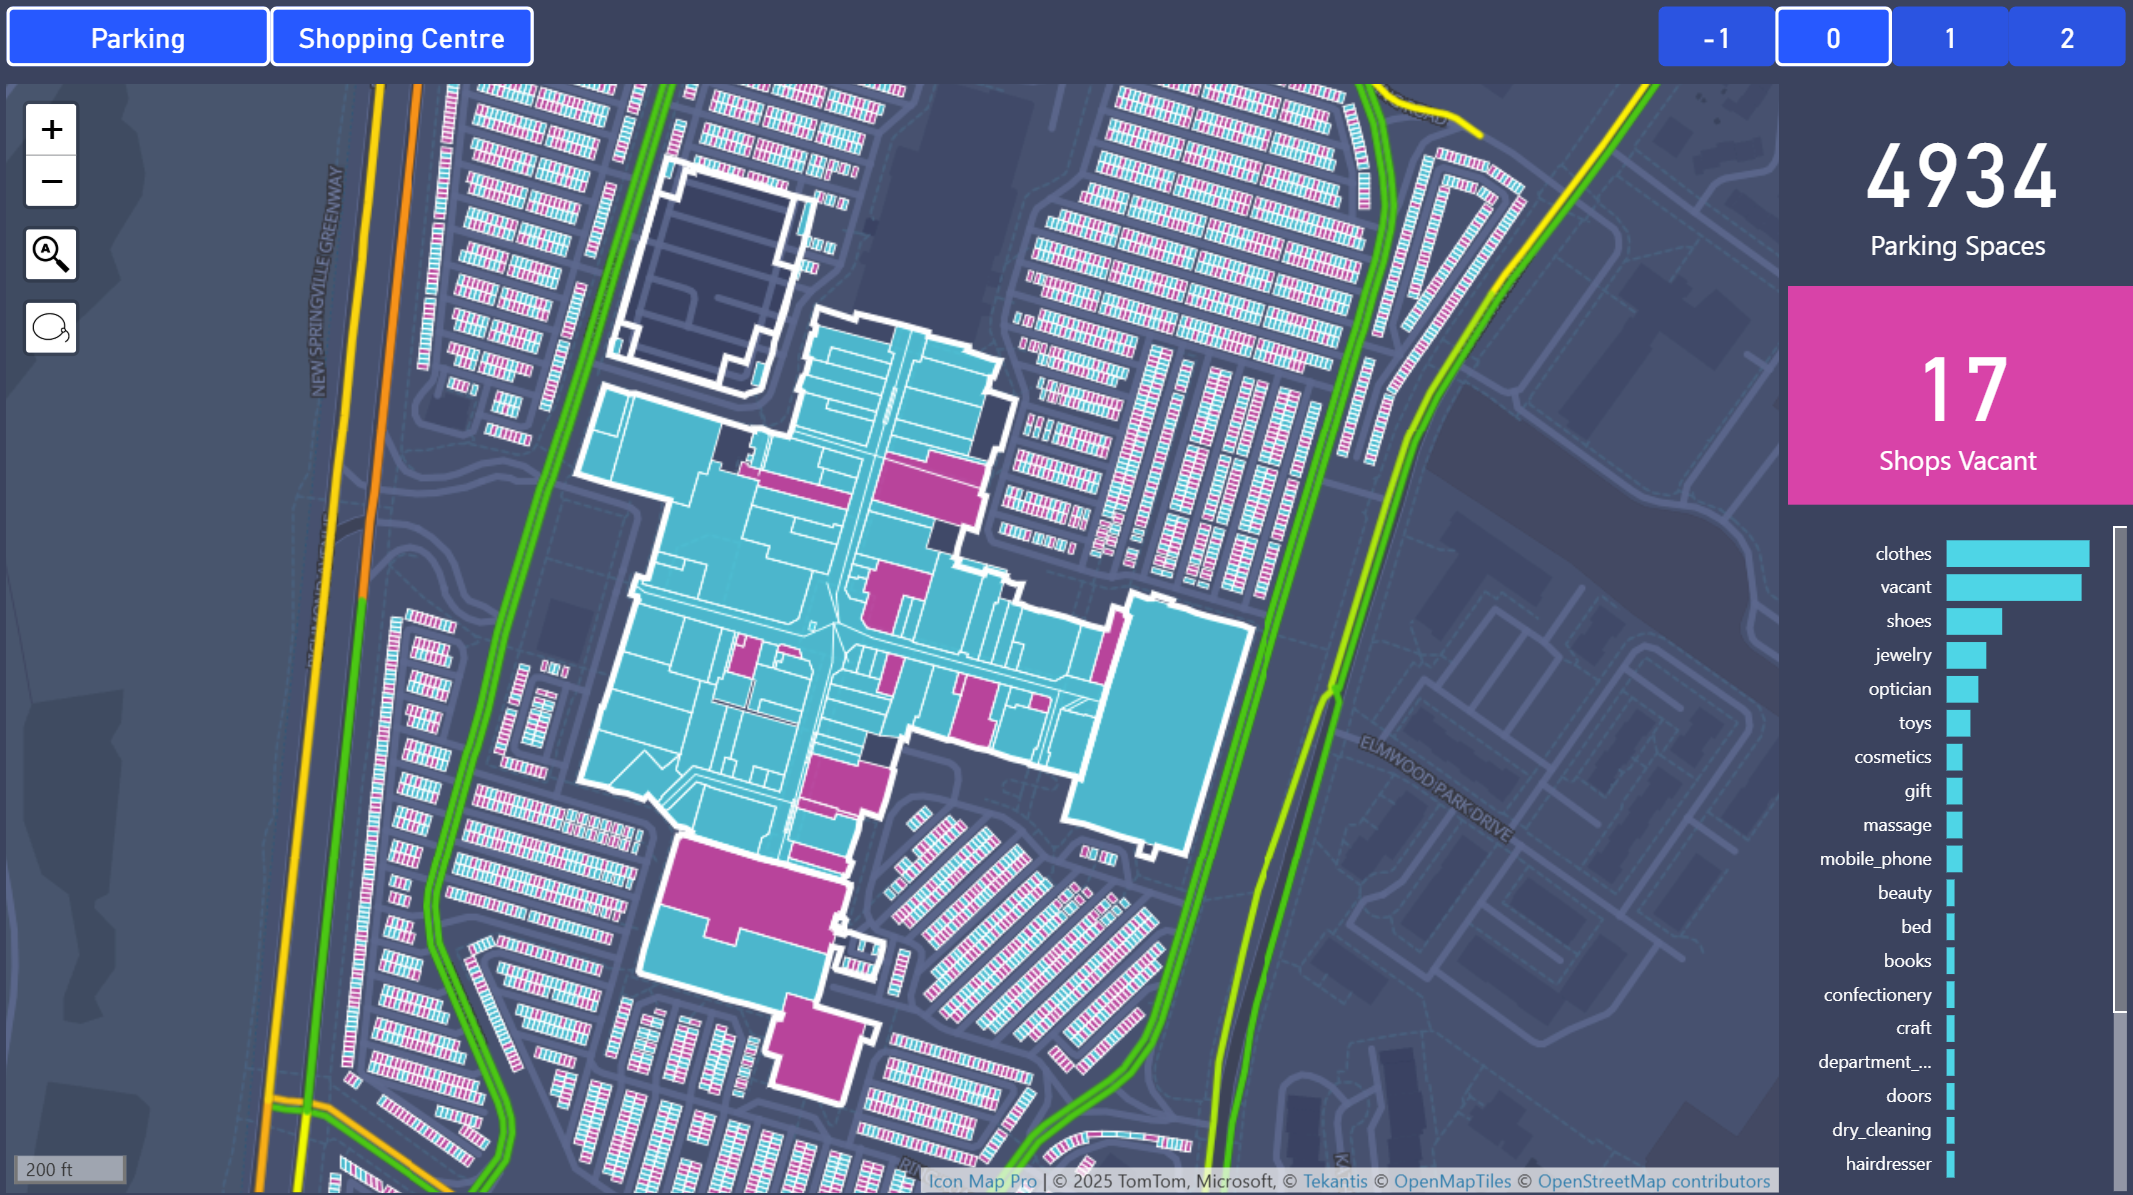
In addition to the floor plan, we discovered that the entire car park had been mapped in OSM, with each individual parking space represented as a polygon and tagged with parking=space. By running a second query and applying some AI-generated synthetic data (more on that in a future blog post), we visualised the car park occupancy, showing which spaces were in use and which were available.
To enhance the visual presentation, we downloaded a GeoJSON layer of the building outline, from OSM, and used it in Icon Map Pro as a Reference Layer, once as a simple white outline, and again as a filled roof polygon. We configured the roof layer to disappear beyond a certain zoom level, creating a subtle visual effect where the roof appears when zoomed out, but disappears to reveal the interior detail when zoomed in.
To enhance the context further, we enabled Icon Map Pro’s live traffic layer to show real-time traffic delays around the shopping centre.
This approach could easily be developed into a comprehensive digital twin of the mall, combining spatial data with operational insights such as footfall heatmaps, tenant turnover, or even predictive maintenance for facilities.
Why This Matters
Icon Map Pro also supports images as backgrounds with x,y coordinates, which we have typically used for indoor mapping, see here for more details. Now, by incorporating structured OSM data and other geocoded sources like CAD exports, we can extend this capability into highly detailed micro-level location analysis. With the flexibility to zoom from room-level detail to a global view, users can create rich, scalable dashboards.
For example, a shopping mall operator could visualise all their malls around the world within one interactive Power BI report, drilling into each site for occupancy, tenant analytics, or maintenance schedules, all while retaining geographic context. The same principle applies across sectors, from healthcare estates to educational campuses and logistics hubs.
Conclusion
Indoor mapping in OpenStreetMap is a largely untapped resource, but it’s full of potential. By combining the flexibility of Power Query, the openness of Overpass API, and the rendering power of Icon Map Pro, we can bring this hidden data to life in Power BI.
Whether you're exploring hospitals, transport hubs, or university campuses, the indoor world is waiting to be mapped. While there is a growing amount of indoor data in OSM, it remains sparse compared to outdoor coverage. We hope this blog inspires more organisations to contribute detailed indoor data for their facilities, helping to build a richer, community-driven view of the world’s interior spaces.