Drilling Down Through Pre-Calculated H3 Hexagons

H3 Hexagons provide a great mechanism for aggregating large volumes of point data. By grouping individual events into consistent hexagonal cells at different resolutions, analysts can quickly move between high-level overviews and detailed, street-level insights. This flexibility is especially powerful in spatial analysis tasks, such as exploring patterns of road traffic accidents, where drilling down from broad regional trends to local hotspots helps uncover both strategic and tactical insights. In this post, we’ll walk through how to enable Power BI drill-down using H3 cells, showing how accident data can be explored seamlessly across multiple spatial resolutions.
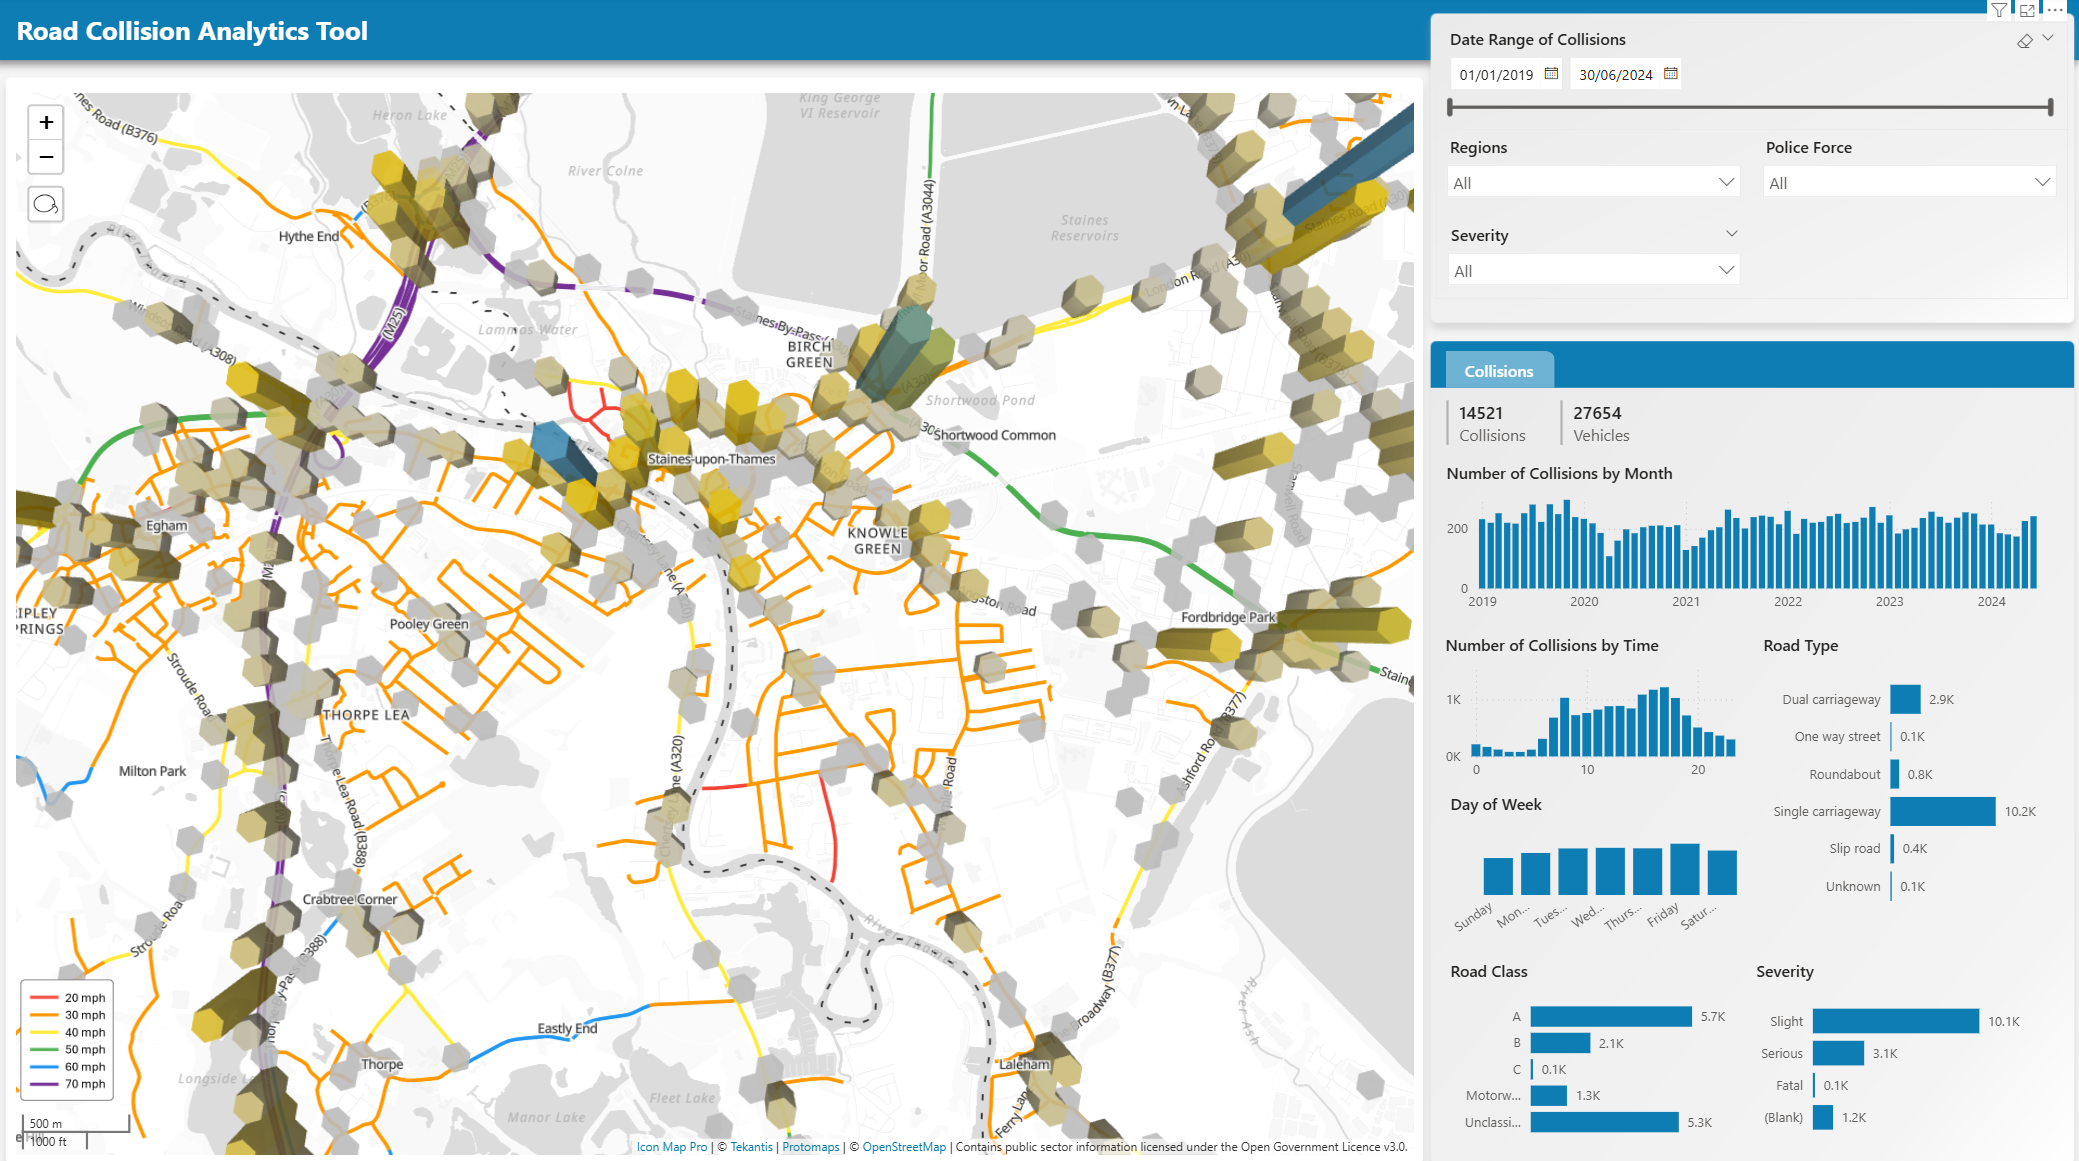
Whilst Icon Map Pro can generate H3 hexagons based on longitude and latitude values provided to the visual, this blog focuses on scenarios where we have already pre-calculated the H3 cells before loading into Power BI.
Taking the road traffic accident example further, each row in my dataset represents a single accident that has occurred in Surrey in the UK. For each of these accidents, we have pre-calculated the H3 cell ID in a number of resolutions:
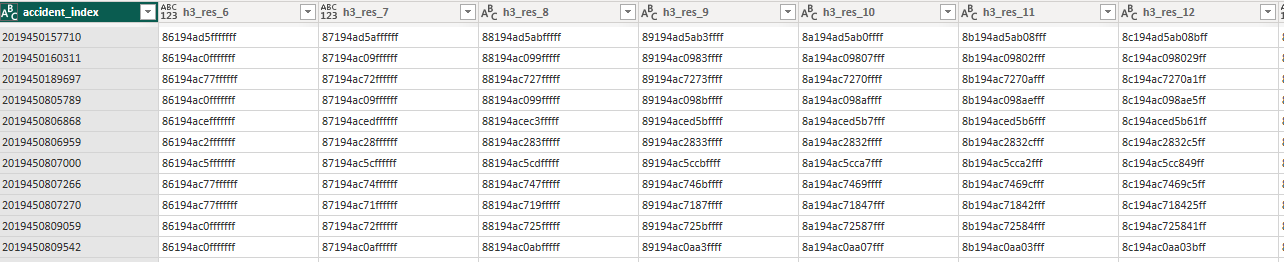
When we have pre-calculated H3 indexes we must assign them to the ID field in Icon Map Pro. To enable drill-down, we can drag all of the H3 fields at increasing resolutions into the ID field well:

And then for the H3 weight, I'm using the number of accidents as a simple count:

This is all the data we need to provide to Icon Map Pro to enable drill-down H3 hexagons.
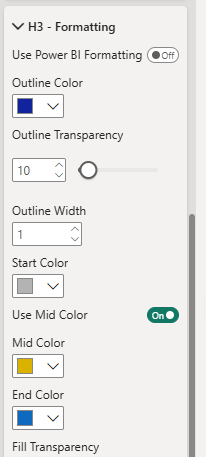
To configure the layer we tell Icon Map Pro that our H3 indexes are pre-calculated as hex references:

And set up the formatting:
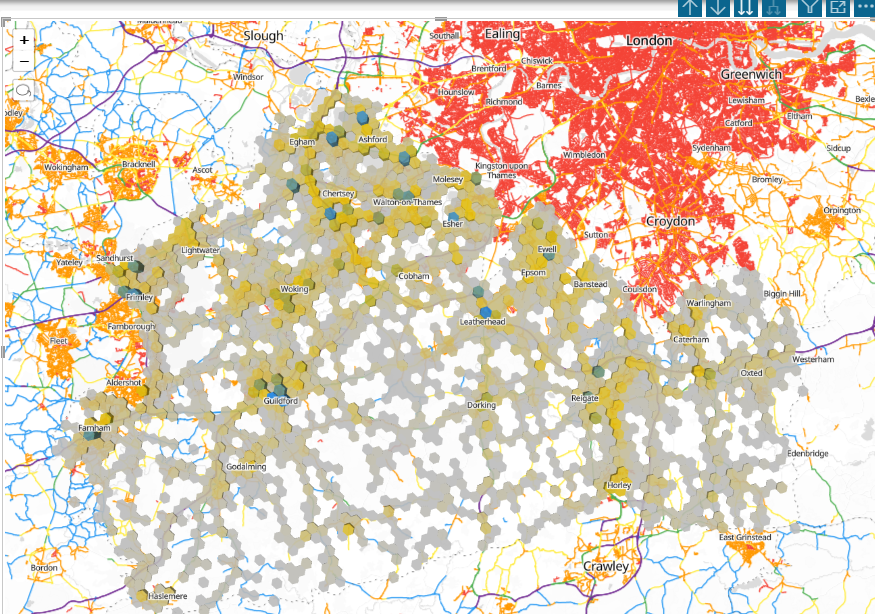
Then we can can start at a low resolution:
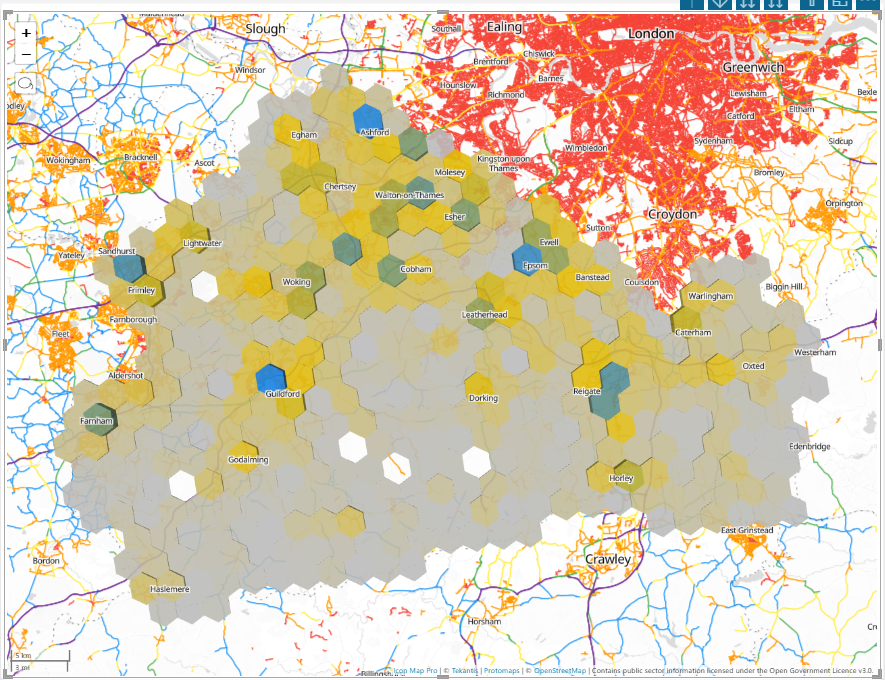
Then use the double drilldown arrow to view all items in more detail:
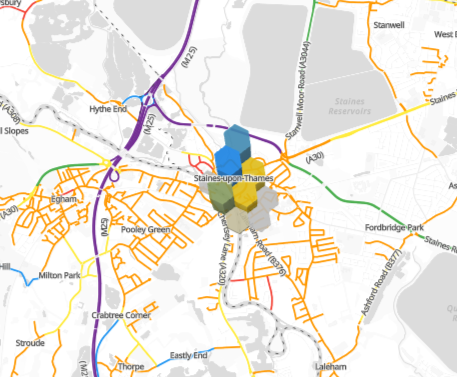
Or the single drill-down arrow to drill into a specific accident hotspot:
You can download the Power BI report used in this example to explore how it was created.