
3 posts tagged with "How To"

View All Tags

Filtering Reference Layers

· 3 min read
James Dales
Co-founder of Tekantis

Icon Map Pro provides the ability to show reference layers on the map. These reference layers are not connected to the Power BI data, they just additional context to the data layer.

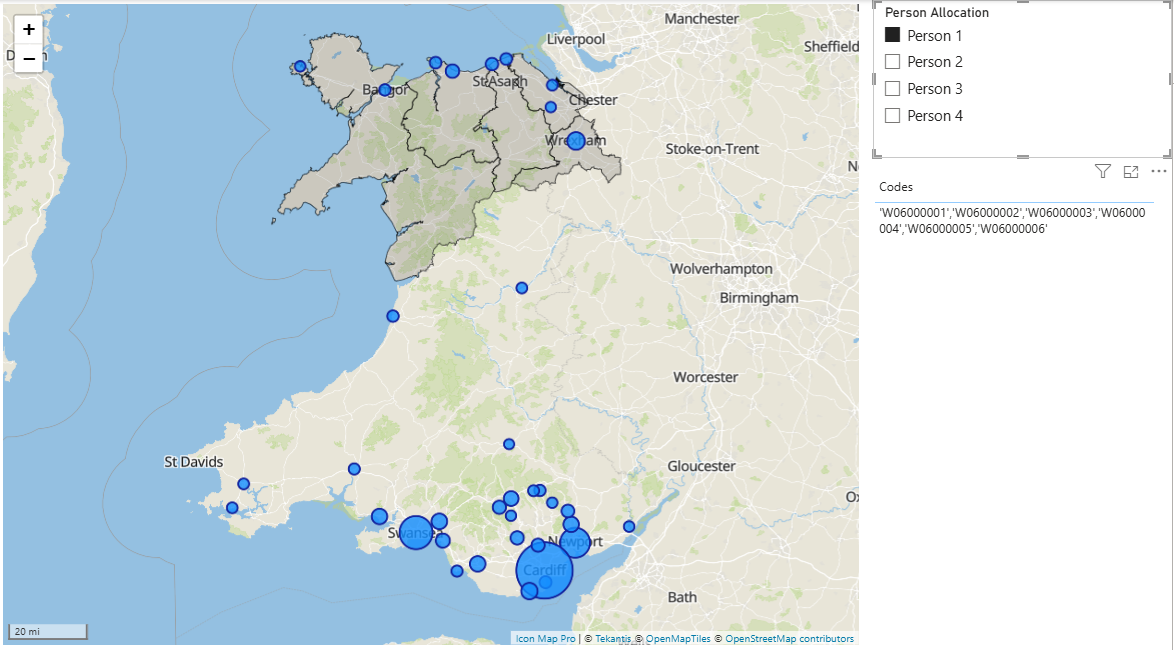
Take this example that shows a map of Welsh local authorities. The circles are a circle data layer, and the local authorities are loaded as a GeoJSON reference layer.

alt text

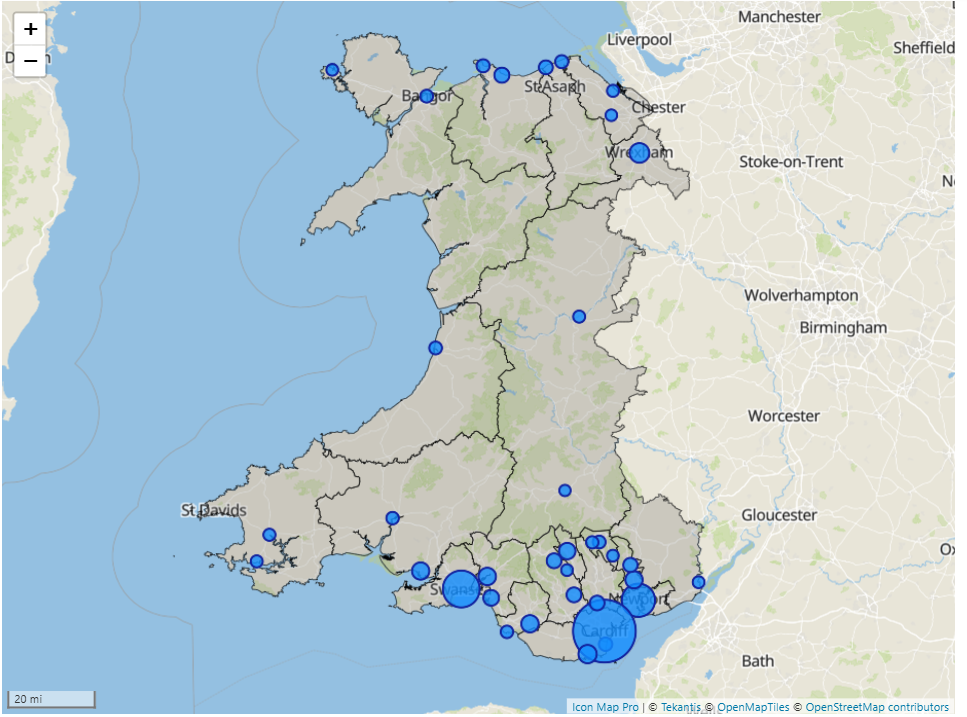
But what if I had a small sales team where each one was responsible for a small number of local authorities, so you only wanted to show those relevant to that person.

We could change the reference layer to being a GeoJSON data layer, but then we'd need to append the relevant local authorities as additional rows of data, which can then get messy from a data preparation and modelling point of view.

Instead, we can filter the features from the GeoJSON reference layer, and only show those related to each sales person.

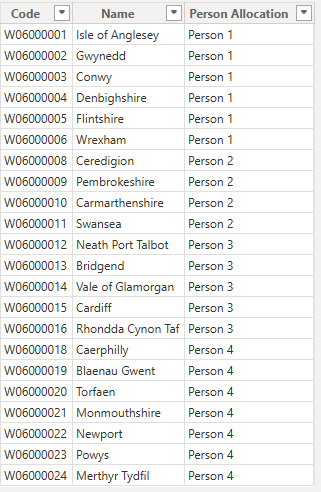
I've added a table of data in my model that lists which area each sales person is responsible for:

alt text

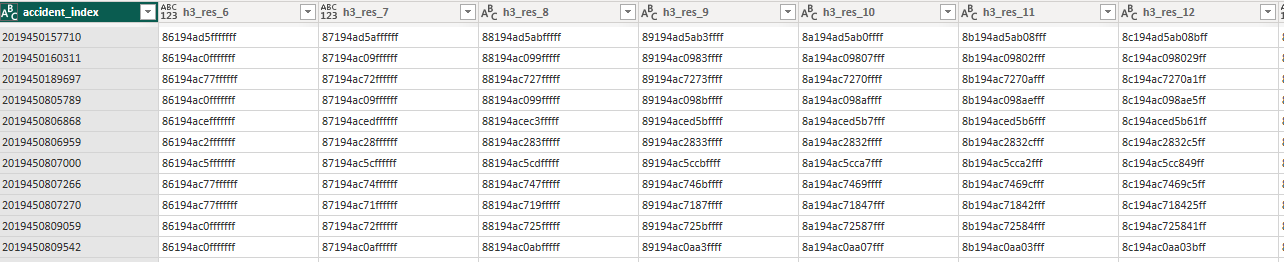
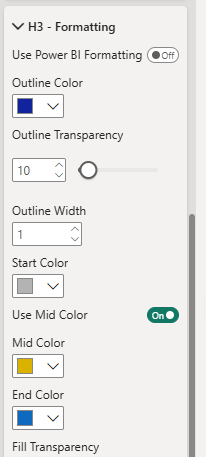
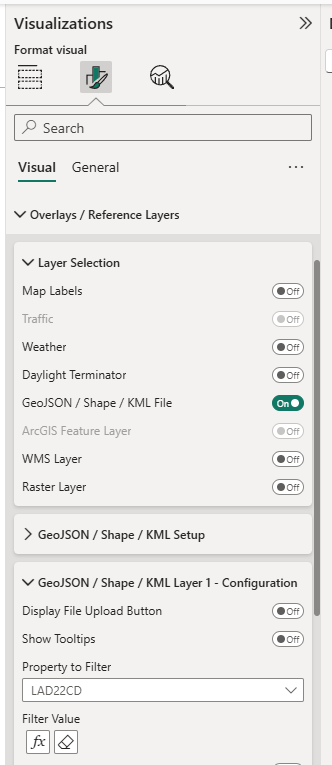
The code field corresponds to a field "LAD22CD" in my GeoJSON file, so in the Icon Map Pro settings for the reference layer, I've selected "LAD22CD" in the "Property to Filter" option:

alt text

If there was just one area for each sales person, we could simply assign the "Code" field from our table to the "Filter Value" setting using the fx button. However, as we have multiple areas per person, we will need to create a DAX measure to generate a concatenated list of areas:

Codes = CONCATENATEX('wales_areas json', "'" & 'wales_areas json'[Code] & "'", ",")

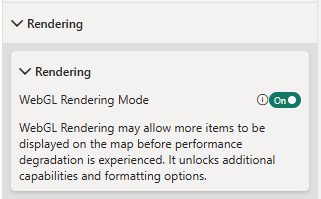
Now we can assign our Codes measure to the Filter Value setting. Note comma separated lists of values are only supported when WebGL Rendering is enabled in the Icon Map Pro settings:

alt text

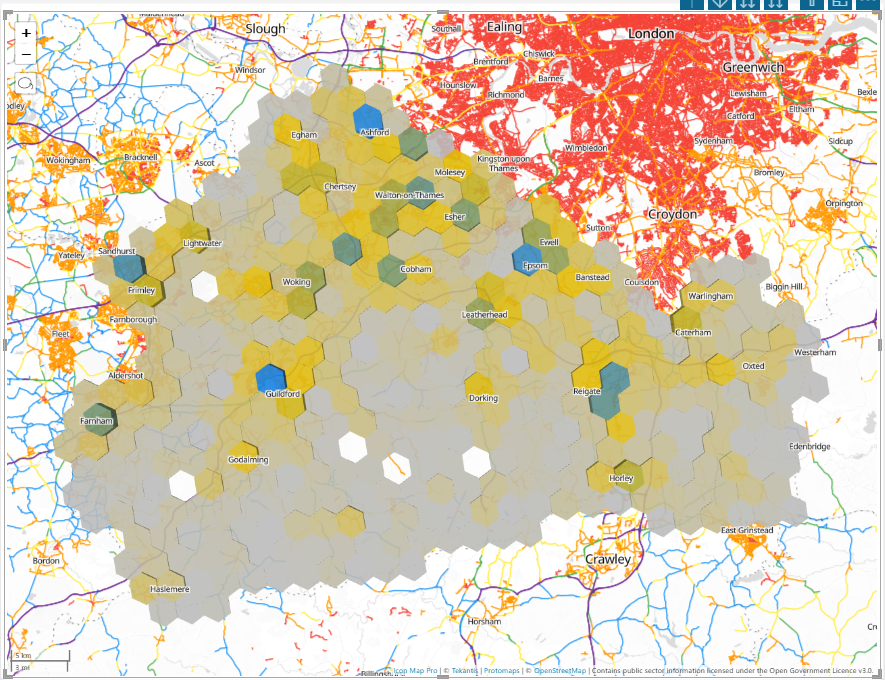
I've added the Person Allocation as a slicer so we can pick the sales person, and their territories will be displayed on the map:

alt text

We can even make this more sophisticated by applying Row Level Security and use the USERPRINCIPALNAME() DAX function to automatically filter to the logged in user. I wouldn't recommend this as a security mechanism, but as a way to automate the filtering.

You can download the Power BI file to see this in action.

Drilling Down Through Pre-Calculated H3 Hexagons

· 2 min read
James Dales
Co-founder of Tekantis

H3 Hexagons provide a great mechanism for aggregating large volumes of point data. By grouping individual events into consistent hexagonal cells at different resolutions, analysts can quickly move between high-level overviews and detailed, street-level insights. This flexibility is especially powerful in spatial analysis tasks, such as exploring patterns of road traffic accidents, where drilling down from broad regional trends to local hotspots helps uncover both strategic and tactical insights. In this post, we’ll walk through how to enable Power BI drill-down using H3 cells, showing how accident data can be explored seamlessly across multiple spatial resolutions.

alt text

Whilst Icon Map Pro can generate H3 hexagons based on longitude and latitude values provided to the visual, this blog focuses on scenarios where we have already pre-calculated the H3 cells before loading into Power BI.

Taking the road traffic accident example further, each row in my dataset represents a single accident that has occurred in Surrey in the UK. For each of these accidents, we have pre-calculated the H3 cell ID in a number of resolutions:

alt text

When we have pre-calculated H3 indexes we must assign them to the ID field in Icon Map Pro. To enable drill-down, we can drag all of the H3 fields at increasing resolutions into the ID field well:

alt text

And then for the H3 weight, I'm using the number of accidents as a simple count:

alt text

This is all the data we need to provide to Icon Map Pro to enable drill-down H3 hexagons.

To configure the layer we tell Icon Map Pro that our H3 indexes are pre-calculated as hex references:

alt text

And set up the formatting:

alt text

Then we can can start at a low resolution:

alt text

Then use the double drilldown arrow to view all items in more detail:

alt text

Or the single drill-down arrow to drill into a specific accident hotspot:

alt text

You can download the Power BI report used in this example to explore how it was created.

Using Meteomatics

· One min read
James Dales
Co-founder of Tekantis

Meteomatics provide a weather API that can be used to overlay a wide range of weather layers onto your map as a WMS overlay.

Meteomatics Screenshot

To use Meteomatics, we need to use access token authentication.

Firstly, set the WMS Server URL as below: https://api.meteomatics.com/wms

Set the Authentication Type to “Token / API Key in URL” Set the Authentication Property Name to “access_token”

Then for the Authentication Property Value you need to get an access token from Meteomatics. Logging into this address will allow you to obtain a token: https://login.meteomatics.com/api/v1/token

Meteomatics uses WMS version 1.3.0 so we need to override Icon Map Pro to use this version:

Set Custom Parameter Name to “version” Set Custom Parameter Value to “1.3.0”

And finally enter the name of the metomatics layer into Layer. Eg “t_2m:C

Configuration