Using star schemas with Icon Map Pro

When explaining how to configure Icon Map Pro, for simplicity and ease of understanding, I usually show the data as a single flat table. This is after all how Icon Map Pro receives the data as the result of the DAX queries that Power BI generates on the fly as you slice and filter your report. However, it's generally regarded as best practice to model your data as facts and dimensions represented as a star schema.
Consider the following model representing crime data:
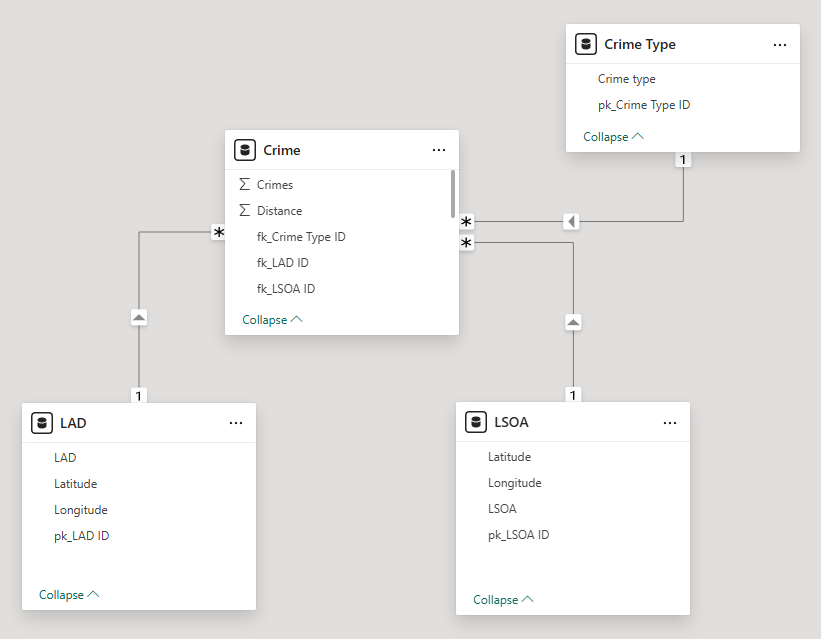
This model has a single fact table, 'Crime', with three dimensions, 'Crime Type', 'LAD' and 'LSOA'. The fact table has 2 measures, Crimes and Distance. The LAD (Local Authority District) and LSOA (Lower-level Super Output Area) dimensions represent different levels of geography and form a geographic hierarchy. Each of these dimensions have the longitude and latitude centroids which we might use for drawing circles on the map, and a code field that we might use for joining to a shape file to show the geographic boundaries on the map.
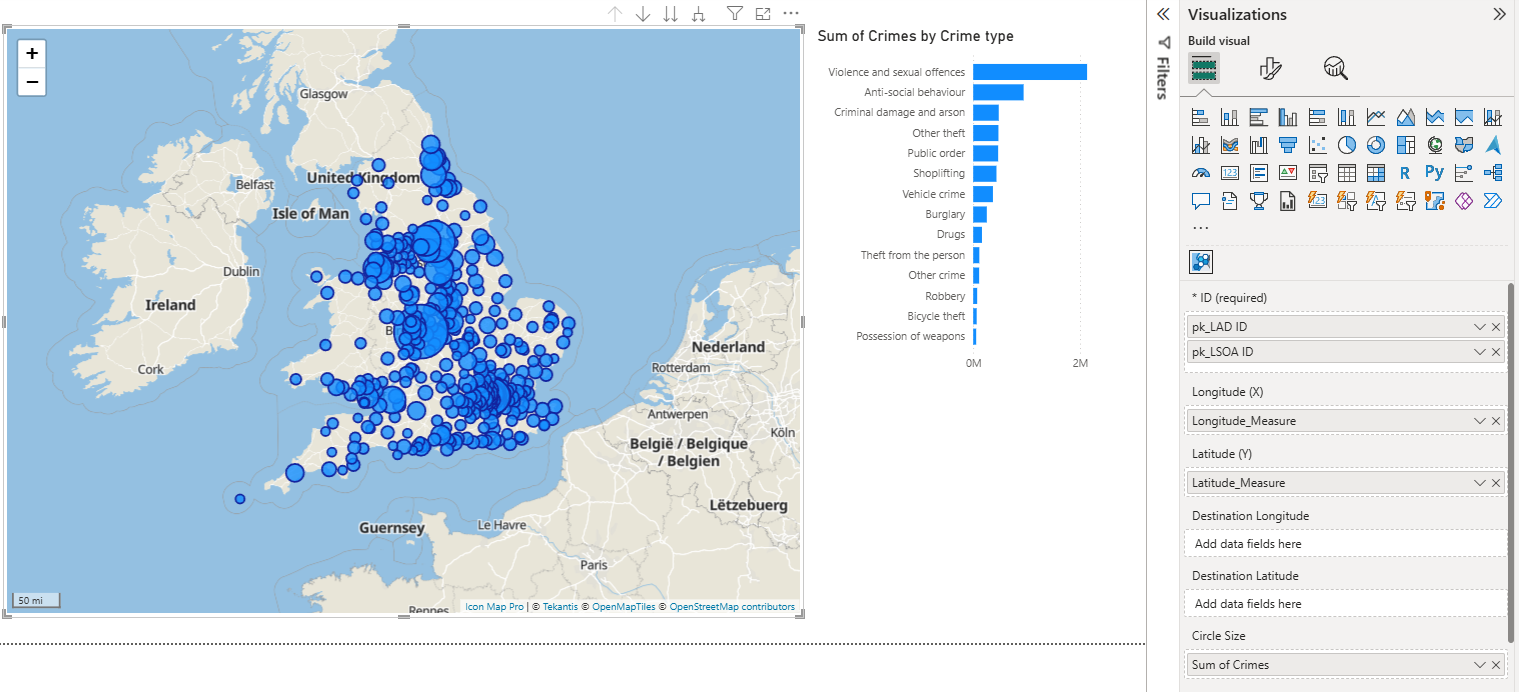
So lets start with drawing circles on the map, with the ability to drill down from LAD to LSOA level. To draw circles on the map, we need to provide Icon Map Pro with ID, Longitude, Latitude and Circle Size fields.
First of all we drag the 'pk_LAD ID' and 'pk_LSOA ID' fields from their respective dimension tables. This then generates a hierarchy in the visual, and the drill-down icons should appear in the corner:
![]()
We can drag our 'Crimes' field from the fact table into the 'Circle Size' box.
We now need to provide Longitude and Latitude values. However, we have these in two different tables depending on the drill-down level. For this case we're going to need to use DAX measures to return the appropriate fields.
First of all I'm going to create measure to return the current level in the hierarchy. I'm creating this as a separate measure so we can reuse it in multiple other measures.
Current Level =
SWITCH (
    TRUE (),
    ISINSCOPE ( LSOA[pk_LSOA ID] ) && HASONEVALUE ( LSOA[pk_LSOA ID] ), "LSOA",
    ISINSCOPE ( LAD[pk_LAD ID] ) && HASONEVALUE ( LAD[pk_LAD ID] ), "LAD",
    BLANK ()
)
It checks to see if the the keys we're using in the map are currently in scope and then returns either "LSOA" or "LAD" accordingly. The HASONEVALUE check is so that we only return a value where something is present in the data.
Now we know which level of the hierarchy we're at, we can create measures for longitude and latitude that return the values from the appropriate tables.
Latitude_Measure =
VAR _CurrentLevel = [Current Level]
RETURN
    SWITCH (
        TRUE (),
        _CurrentLevel = "LSOA",
            CALCULATE (
                AVERAGE ( LSOA[Latitude] ),
                TREATAS ( VALUES ( Crime[fk_LSOA ID] ), LSOA[pk_LSOA ID] )
            ),
        _CurrentLevel = "LAD",
            CALCULATE (
                AVERAGE ( LAD[Latitude] ),
                TREATAS ( VALUES ( Crime[fk_LAD ID] ), LAD[pk_LAD ID] )
            )
    )
and
Longitude_Measure =
VAR _CurrentLevel = [Current Level]
RETURN
    SWITCH (
        TRUE (),
        _CurrentLevel = "LSOA",
            CALCULATE (
                AVERAGE ( LSOA[Longitude] ),
                TREATAS ( VALUES ( Crime[fk_LSOA ID] ), LSOA[pk_LSOA ID] )
            ),
        _CurrentLevel = "LAD",
            CALCULATE (
                AVERAGE ( LAD[Longitude] ),
                TREATAS ( VALUES ( Crime[fk_LAD ID] ), LAD[pk_LAD ID] )
            )
    )
These measures return the longitude and latitude values from the appropriate tables according to the current level of the hierarchy. Whilst we're using the AVERAGE function on the values, at the time of evaluation, there should only be one value per LAD or LSOA, so the values aren't actually changed - the average of one value is that one value.
Because the relationship between the LAD and its child LSOAs is defined within the fact table, the filter direction on the relationship will mean that it's not able to return the longitude and latitudes for just the child LSOAs, so we use TREATAS to use the key from the fact table to ensure that the hierarchy relationship is represented.
With these measures, we can now configure our visual.
If we're creating a filled map using a shape file, then we can simply drag in the the appropriate fields in to the "Feature Reference" box from each dimension table:

or we can create a measure in the same way as we have for longitude and latitude and drag that in instead:

using this measure
Feature Reference =
SWITCH (
    [Current Level],
    "LSOA",
        CALCULATE (
            MAX ( LSOA[LSOA] ),
            TREATAS ( VALUES ( Crime[fk_LSOA ID] ), LSOA[pk_LSOA ID] )
        ),
    "LAD",
        CALCULATE (
            MAX ( LAD[LAD] ),
            TREATAS ( VALUES ( Crime[fk_LAD ID] ), LAD[pk_LAD ID] )
        )
)
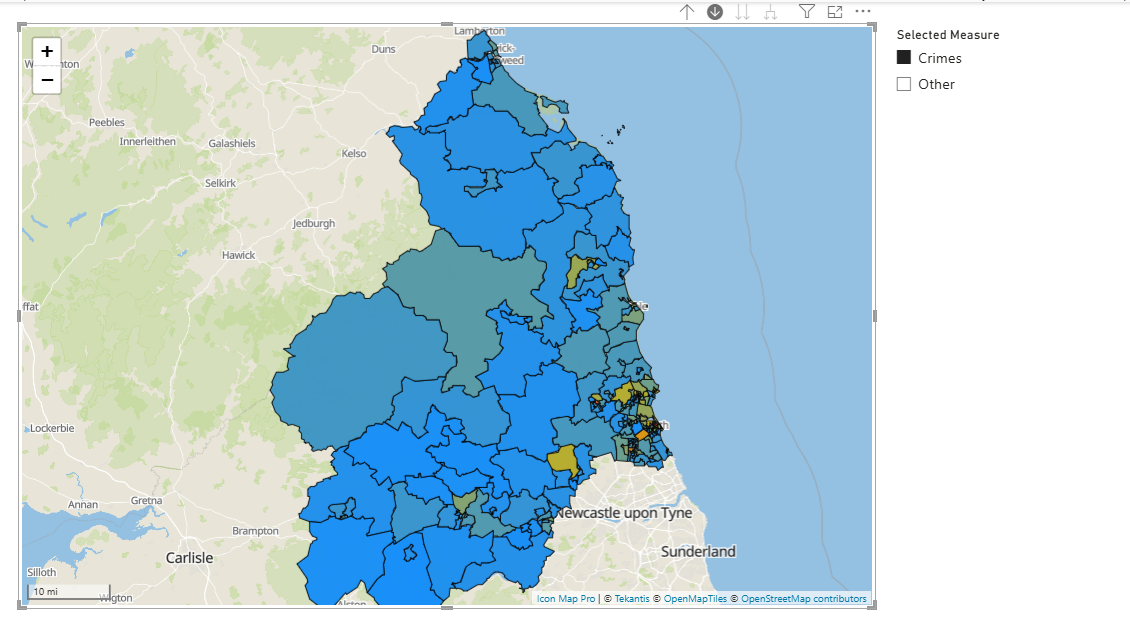
Here's the resulting Power BI report
You can download the Power BI report file to see how it is all put together.